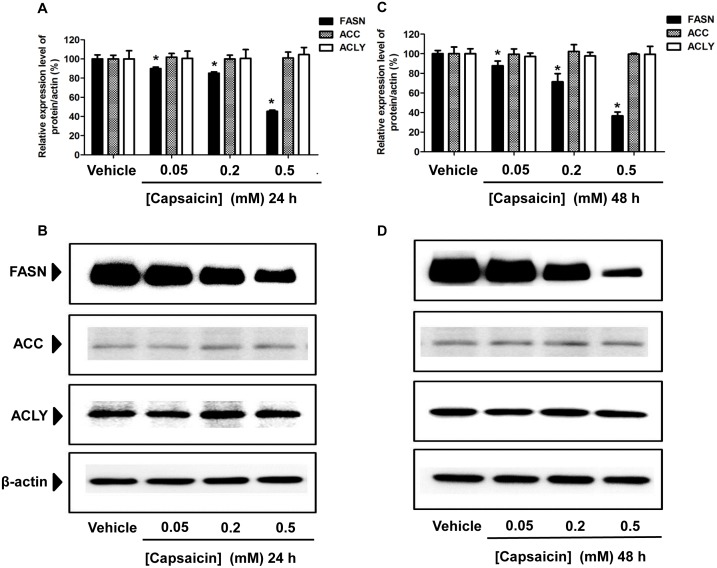
Figure 5. Effect of capsaicin on the expression of FASN, ACC, and ACLY protein levels in HepG2 cells.
HepG2 cells were incubated with 0.05, 0.2, and 0.5 mM of capsaicin for 24 h (A, B) and 48 h (C, D), and then the cell lysates were subjected to the SDS-PAGE system. Protein expressions were detected by specific antibodies and. β-actin was used as an internal standard to confirm the integrity and equal protein loading. The bar graph (A, C) shows the quantification of band intensity as a ratio of the individual band intensity relative to the β-actin band intensity in the same blot (e.g. FASN/β-actin). The band (B, D) results shown are representative of those obtained from at least three independent experiments. Data are expressed as means ± SD from at least three separate experiments performed in triplicate, n = 5, *p<0.05.

