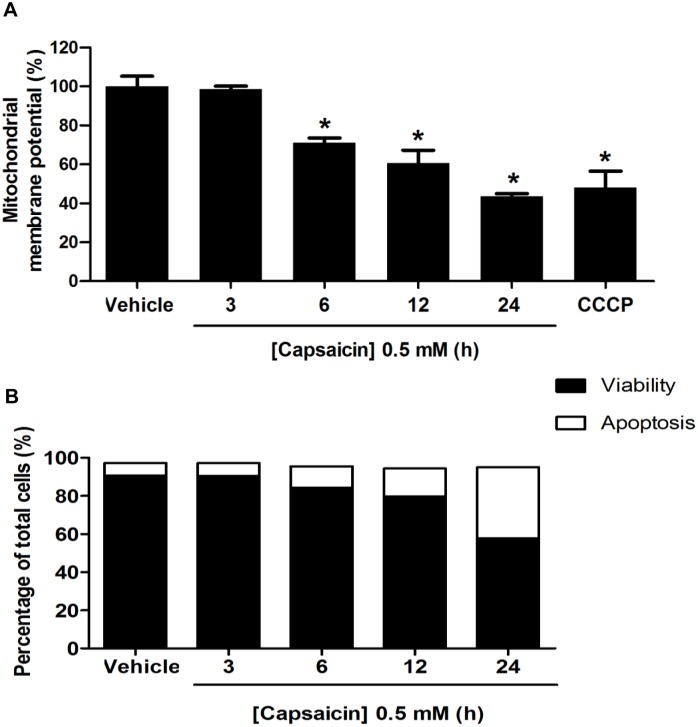
Figure 7. Effect of capsaicin on induction of mitochondrial dependent apoptosis in HepG2 cells.
HepG2 cells were incubated with 0.5 mM capsaicin for 3 to 24 h. (A) The ΔΨm was examined by 2 µM JC-1 dye and detected by flow cytometry. The control was defined as cells treated with a medium or 0.1% DMSO vehicle without capsaicin. Histograms show the percentage of an energized and high polarization mitochondrial state as calculated by a ratio of red and green fluorescence intensity compared to the control. The decrease in percentage of ΔΨm represented a decrease in the red to green fluorescence intensity ratio. CCCP was used as a positive control to induce disruption of ΔΨm. (B) The effect of capsaicin on the rate of apoptosis on HepG2 cells following 0.5 mM capsaicin treatment for 3 to 24 h. The percentages of cell populations were expressed as bar charts showing the proportion of viable and apoptotic cells detected by flow cytometry using dual staining of PI and Alex flour-Annexin V fluorescence. Data from at least three independent experiments performed in at least triplicates are presented as means ± SD, n = 3.

