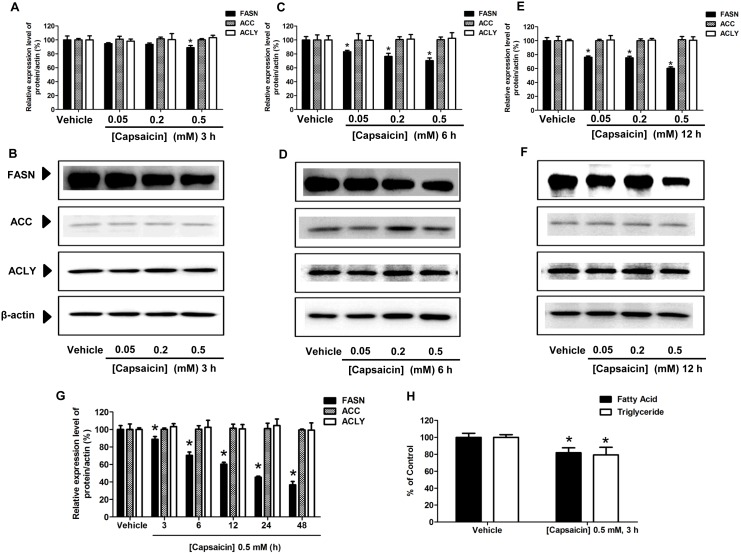
Figure 9. Effect of capsaicin on the expression of FASN, ACC, and ACLY protein levels in HepG2 cells.
HepG2 cells were incubated with 0.05, 0.2, and 0.5 mM of capsaicin for 3 h (A, B), 6 h (C, D), and 12 h (E, F). (G) Histograms show the time-course effect of 0.5 mM capsaicin on protein expression in HepG2 cells for 3 to 48 h. Equal amounts of total protein were subjected to immunoblotting analysis with specific antibodies. β-actin was used as the internal standard to confirm the integrity and equal protein loading. Immunoreactive bands shown are representative of those obtained from at least three independent experiments. The bar graph shows the quantification of band intensity as a ratio of the individual band intensity relative to the β-actin band intensity in the same blot (e.g. FASN/β-actin). (H) Intracellular long chain fatty acid and triglyceride synthesis were determined by using the free fatty acid and triglyceride quantification kits following 0.5 mM capsaicin treatment for 3 h. The control was defined as cells treated with a medium or vehicles without capsaicin. Data are expressed as means ± SD from at least three separate experiments performed in triplicate, n = 3, *p<0.05.

