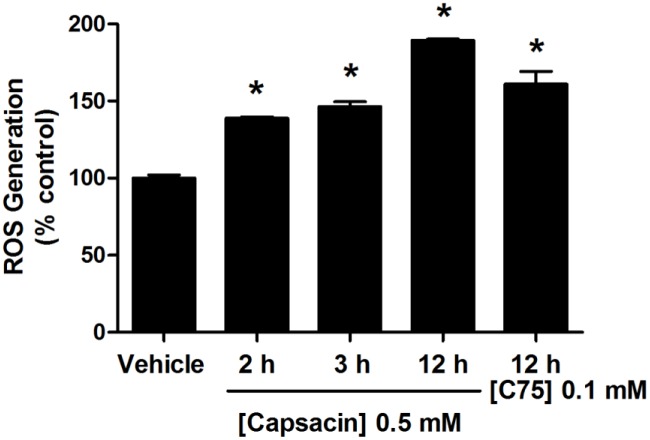
Figure 10. Effect of capsaicin on ROS generation in HepG2 cells.
HepG2 cells were treated with 0.5 mM of capsaicin for 2, 3, and 12 h. The control was defined as cells treated with a medium or 0.1% DMSO vehicle without capsaicin. ROS production was measured by CM-H2DCFDA fluorescent dye and detected by flow cytometry. Representative histogram plots using flow cytometric analysis indicate percentage of ROS generation compared to the control group (100%). ROS production following 0.1 mM C75 treatment for 12 h was measured. Data are expressed as means ± SD from at least three separate experiments performed in triplicate, n = 3, *p<0.05.

