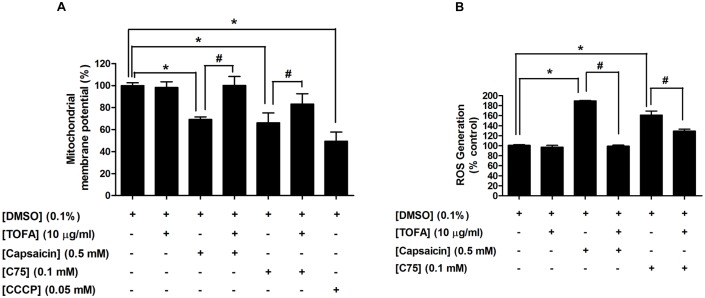
Figure 11. An accumulation of Malonyl-CoA plays a vital role in capsaicin-induced apoptosis in HepG2 cells.
HepG2 cells were treated with 0.5 mM capsaicin or 0.1 mM C75 or 10 µg/ml TOFA for 12 h. Co-incubation of capsaicin or C75 with TOFA was performed by pre-incubation TOFA 1 h before treatment cells with capsaicin or C75. The control was defined as cells treated with a medium or 0.1%DMSO vehicle alone. (A) The ΔΨm was examined by 2 µM JC-1 dye and detected by flow cytometry. Histograms show the percentage of an energized and high polarization mitochondrial state as calculated by a ratio of red and green fluorescence intensity compared to the control. The decrease in percentage of ΔΨm represented a decrease in the red to green fluorescence intensity ratio. CCCP at 0.05 mM was used as a positive control to induce disruption of ΔΨm. (B) ROS production was measured by CM-H2DCFDA fluorescent dye and detected by flow cytometry. Histogram plots using flow cytometric analysis indicates percentage of ROS generation compared to the control group (100%). Data are expressed as means ± SD from at least three separate experiments performed in triplicate, n = 3, *p<0.05.

