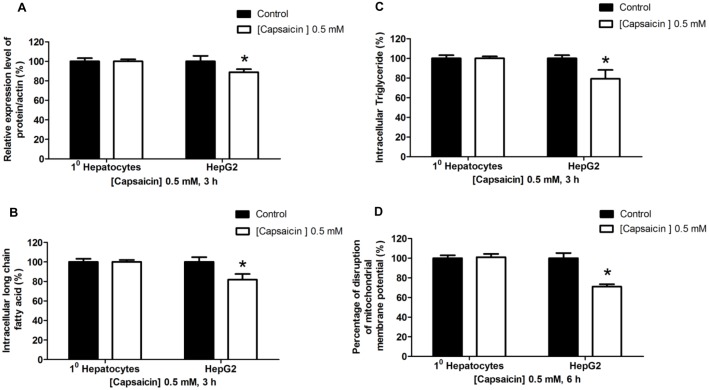
Figure 12. Effects of capsaicin on normal human hepatocytes compared with HepG2 cells.
Cells were treated with 0.5 mM concentration of capsaicin for 3 h or 6 has indicated. The control was defined as cells treated with a medium or vehicles without capsaicin. (A) The bar graph shows the quantification of band intensity as a ratio of FASN protein band intensity relative to the β-actin band intensity in the same blot (e.g. FASN/β-actin). (B) For the effect of capsaicin on intracellular long chain fatty acid and (C) triglyceride synthesis determined by using the free fatty acid and triglyceride quantification kit, data are represented as percentage of the individual value in nmol/µL compared to 100% of control values. (D) The bar chart shows the percentage of disruption of mitochondrial membrane potential relative to the control (set as 100%) after 6 h of capsaicin treatment by JC-1 fluorescence dye staining and detected by flow cytometry. Data from at least three independent experiments performed in triplicate are shown as means ± SD, n = 3, *p<0.05.

