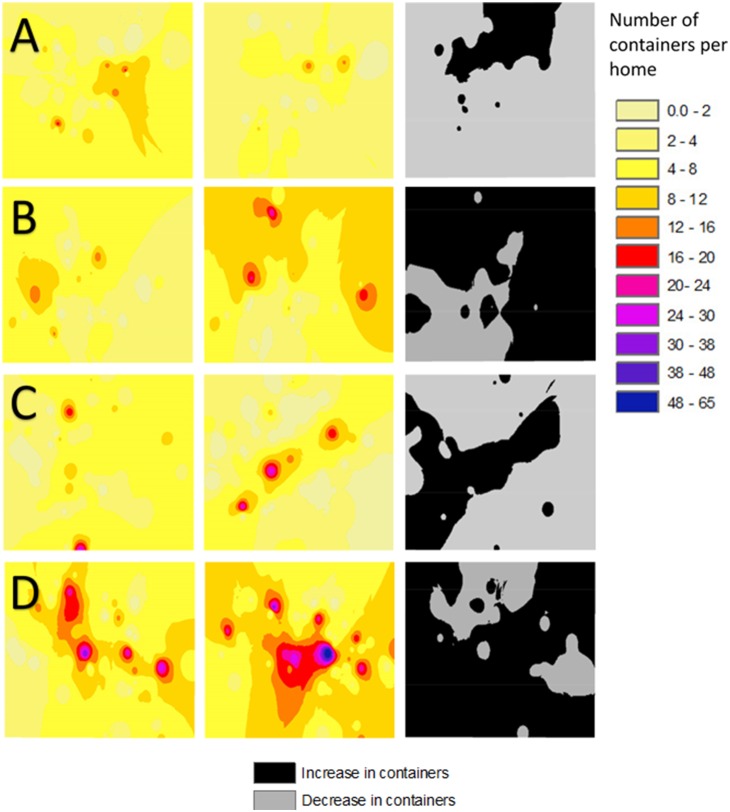
Figure 3. Spatial distributions of the number of container habitats per home sampled in sites receiving education (treatment sites) and those not receiving education (control sites).
The columns represent the number of containers before education, (1st column) immediately following education (2nd column) and the difference between the two (3rd column, in black & grey). In homes with no change in container number, they were classified along with a decrease in containers. The rows summarize Monmouth county treatment site (A), Monmouth county control site (B), Mercer county treatment site (C), and Mercer county control site (D).

