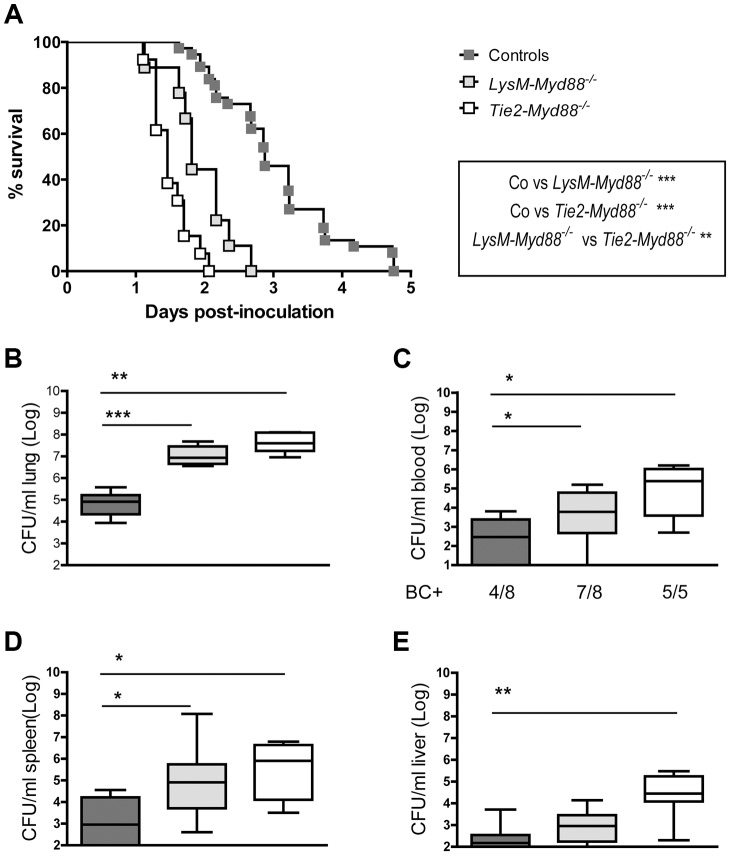
Figure 2. Impaired survival and bacterial defense in LysM-Myd88−/− and Tie2-Myd88−/− mice.
Control, LysM-Myd88−/− and Tie2-Myd88−/− mice were intranasally infected with ∼6×10³ CFU K. pneumoniae. Survival of control (dark grey symbols, n = 37), LysM-Myd88−/− (light grey symbols, n = 9) and Tie2-Myd88−/− mice (white symbols, n = 13) expressed as Kaplan-Meier plot (A), bacterial loads in lung (B), blood (C), spleen (D) and liver (E), of control (dark grey bars, n = 8), LysM-Myd88−/− (light grey bars, n = 8) and Tie2-Myd88−/− mice (white bars, n = 5 mice). Data are expressed as box-and-whisker diagrams depicting the smallest observation, lower quartile, median, upper quartile, and largest observation. BC+ = number of positive blood cultures. Survival curves were compared with Log-Rank test Bacterial loads were compared to control mice determined with Mann-Whitney U test: * p<0.05, ** p<0.01, *** p<0.001.

