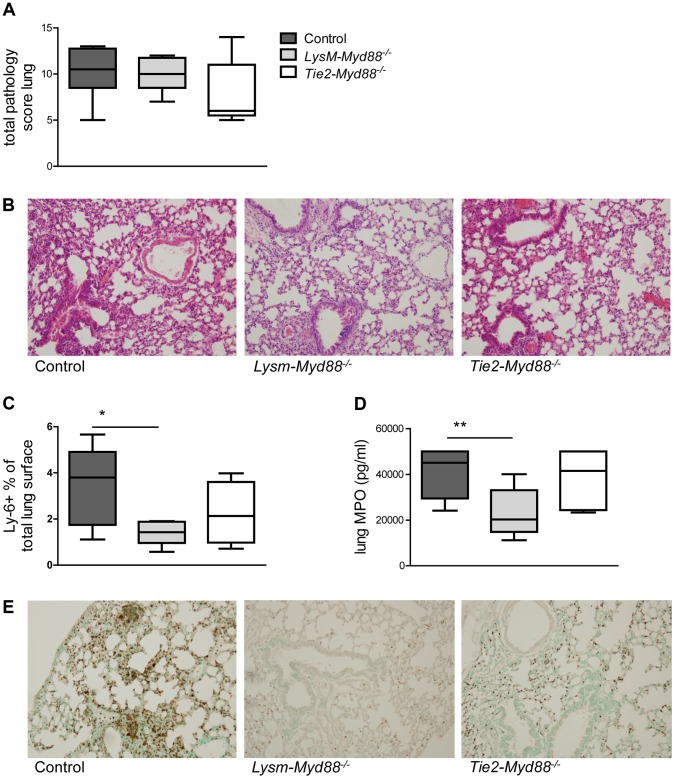
Figure 3. Lung inflammatory response.
Mice were intranasally infected with ∼6×10³ CFU K. pneumoniae; Histological scores 24 hours after infection determined as described in the Methods section, in control (dark grey, n = 8), LysM-Myd88−/− (light grey, n = 8) and Tie2-Myd88−/− mice (white, n = 5) (A). Panel (B) shows representative lung histology of control, LysM-Myd88−/− and Tie2-Myd88−/− mice H&E staining, original magnification 20×. Neutrophil influx compared between mouse groups as reflected by Ly6 lung surface positivity (C) and whole lung MPO levels (D). Panel (E) shows representative images of Ly-6 staining on lung slides from control, LysM-Myd88−/− and Tie2-Myd88−/− mice; Data are expressed as box-and-whisker diagrams depicting the smallest observation, lower quartile, median, upper quartile, and largest observation. * p<0.05, ** p<0.01.

