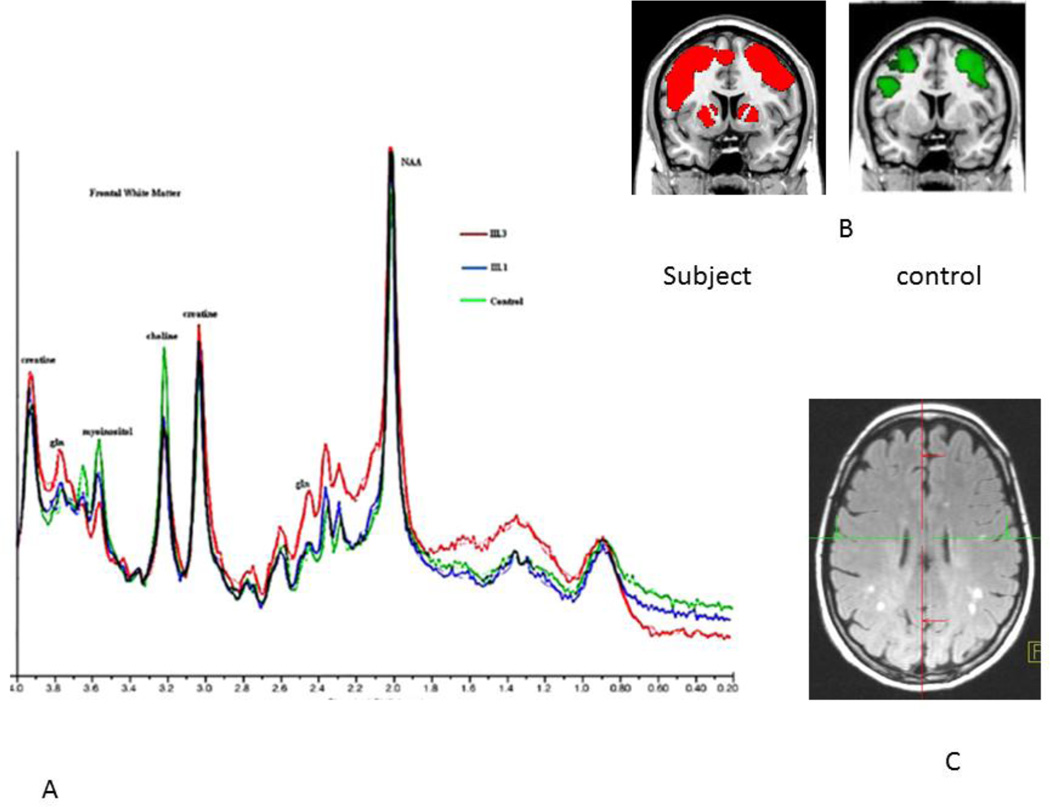
Figure 2.
This composite shows changes observed in subjects with OTCD. In panel A, spectroscopy demonstrating overlapping spectra in three subjects. In Red, an affected female, in blue, her carrier sister who is unaffected, and in green an age matched control. Glutamine is elevated in the symptomatic subject, intermediate in the carrier, asymptomatic and normal in the control. Likewise, choline is decreased equally in both sisters. For myoinositol, the concentration follows the clinical symptoms, normal in the control, intermediate in the asymptomatic carrier, and low in the affected patient. In panel B, activation map from fMRI working memory task shows increased frontal and basal ganglia activation in subjects but not controls and in panel C, discrete areas of T2 signal seen on FLAIR seen with increased frequency in OTCD patients versus age matched controls. Reprinted with permission from Mol Genet Metab. 2008; 94(1): 52–60.

