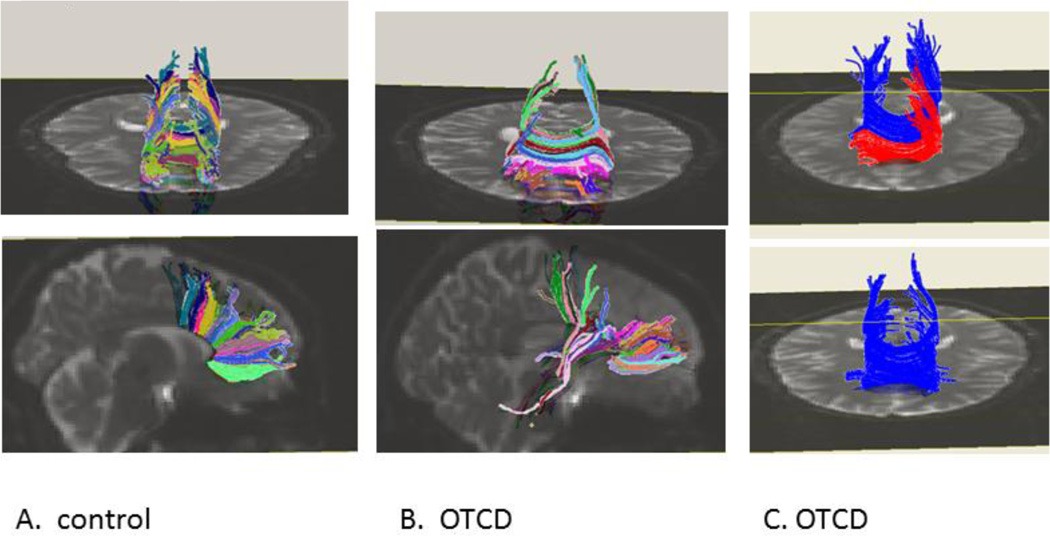
Figure 6.
Normal control (A) and OTCD (B and C) : tractography shows more robust fiber density in control subject in corpus callosum fibers. Additionally in panel C patient with OTCD has absence of anterior crossing fibers in corpus callosum. Modified and reprinted from Mol Genet Metab. 2011; 104(3): 195–205.

