Figure 6.
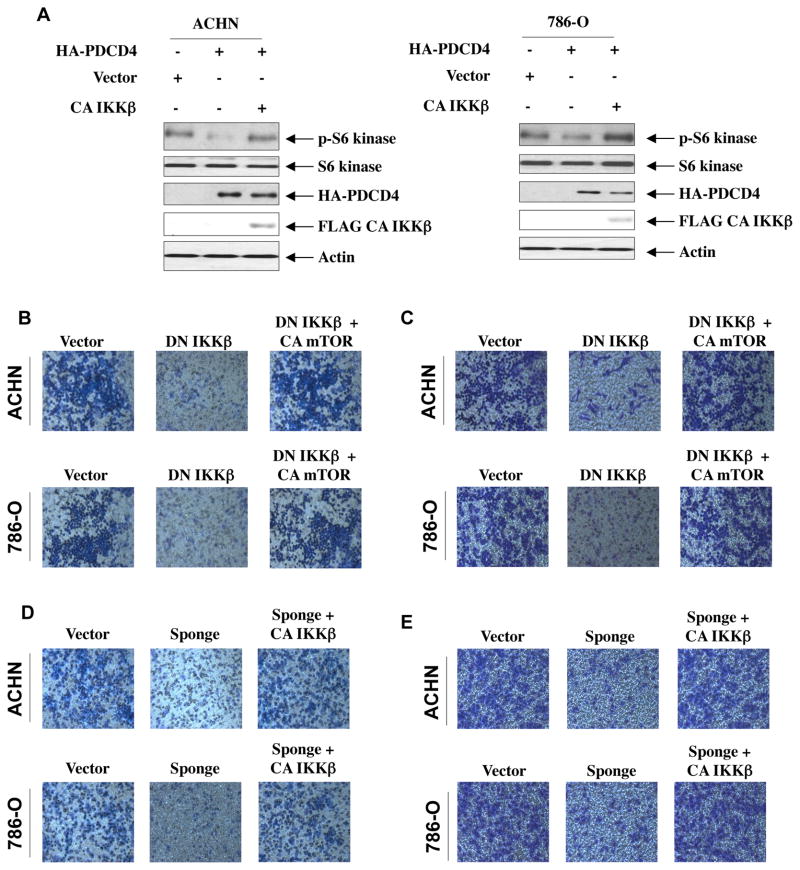
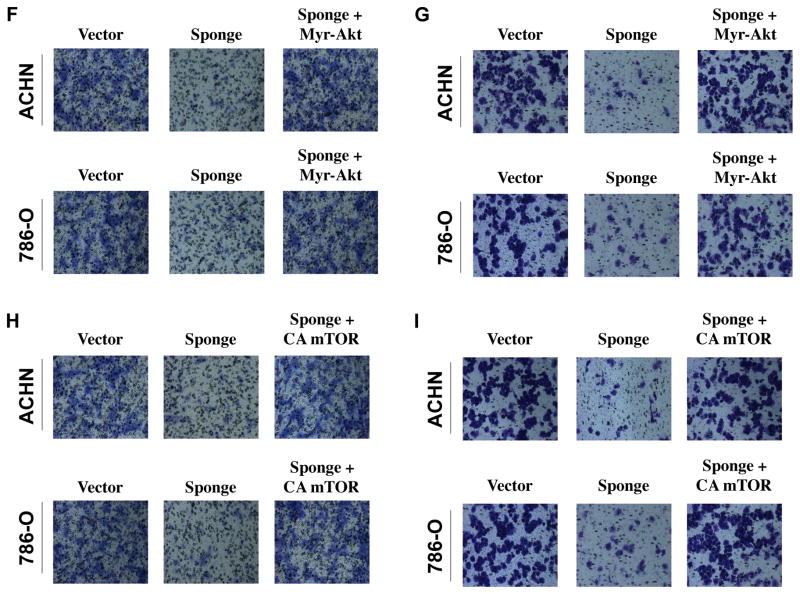
IKKβ and mTORC1 downstream of miR-21 regulate migration and invasion of renal carcinoma cells. (A) Expression of CA IKKβ prevents PDCD4-inhibited mTORC1 activity in renal cancer cells. ACHN and 786-O renal carcinoma cells were transfected with PDCD4 and CA IKKβ as indicated. The cell lysates were immunoblotted with phospho-S6 kinase (Thr-389), S6 kinase and actin antibodies. Same lysates were run in parallel to immunoblot with HA and FLAG antibodies. Quantification of these results is shown in Supplementary Fig. S11A. (B and C) Expression of CA mTORC1 reverses dominant negative IKKβ-induced inhibition of migration (panel B) and invasion (panel C) of renal cancer cells. ACHN and 786-O cells were transfected with dominant negative (DN) IKKβ and CA mTORC1 as indicated. Migration (panel B) and invasion (panel C) of these cells were determined as described in the Materials and Methods. Expression of DN IKKβ, CA mTORC1 and quantification of these results is shown in Supplementary Fig. S11B and S11C. (D and E) IKKβ regulates miR-21-induced migration and invasion of renal cancer cells. ACHN and 786-O cells were transfected with miR-21 Sponge and CA IKKβ as indicated. Migration (panel D) and invasion (panel E) of these cells were determined as described in the Materials and Methods. Expression of CA IKKβ and miR-21 Sponge for panels D and E was examined in parallel experiments and shown in Supplemental Figs. S11D – S11E. Quantification of migration and invasion for panels D and E is shown in Supplementary Fig. S11D – S11E. (F and G) Expression of Myr-Akt prevents miR-21 Sponge-induced inhibition of migration and invasion of renal cancer cells. ACHN and 786-O cells were transfected with miR-21 Sponge and Myr-Akt as indicated. Migration (panel F) and invasion (panel G) of these cells were determined as described in the Materials and Methods. Quantification of these results, expression of Myr-Akt and expression of miR-21 Sponge are shown in Supplementary Fig. S11F and S11G. (H and I) Expression of CA mTORC1 reverses miR-21 Sponge-induced inhibition of migration (panel H) and invasion (panel I) of renal cancer cells. ACHN and 786-O cells were transfected with miR-21 Sponge and CA mTOR as indicated. Migration (panel H) and invasion (panel I) of these cells were determined as described in the Materials and Methods. Quantification of these results, expression of CA mTOR and expression of miR-21 Sponge are shown in Supplementary Fig. S11H and S11I.


