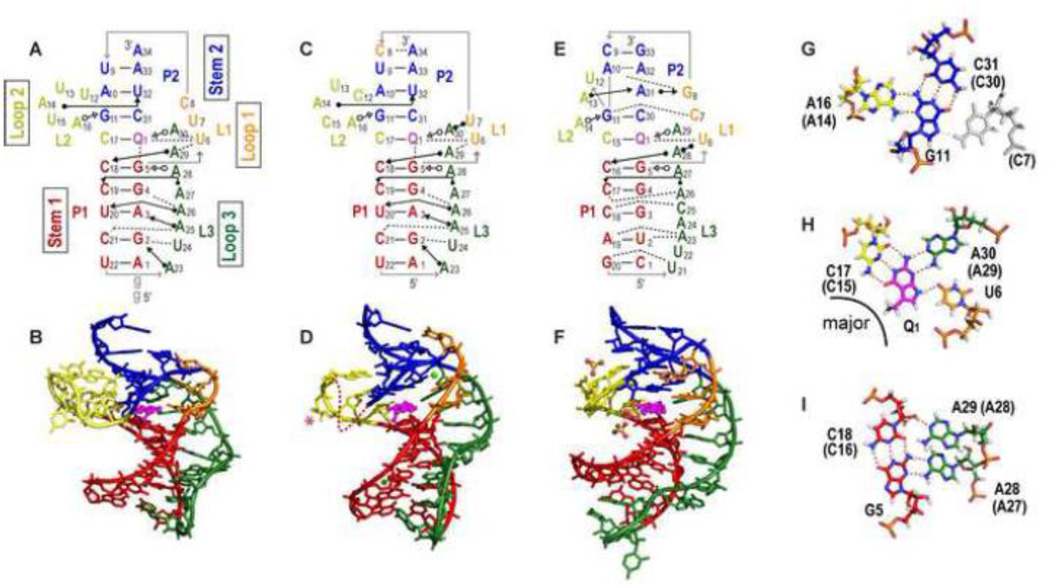
Figure 3.
Structures of PreQ1-I riboswitch aptamers. (A-B) Solution NMR structure of Bsu (C12,15U) [PDB ID 2L1V), (C-D) X-ray crystal structure of Bsu WT [PDB ID 3FU2] (E-F) X-ray crystal structure of Tte WT [PDB ID 3Q50]. (A,C,E) Schematics of secondary structures with base interactions illustrated using the symbols from Leontis and Westhof notation [87]. (B, D, F) Three-dimensional structures. Nucleotides C12 and U13 (shown as a dotted line) and the base of C15 (marked with an asterisk) are missing from the electron density in the Bsu WT crystal structure (D). Mg2+ and SO42− are depicted as green, and yellow and red spheres, respectively. (G, H, I) Stick representation of the three layers of the PreQ1-I binding pocket (from Bsu WT) showing (G) ‘ceiling’: loop 1-stem 2 A-G-C triple (A-G-C-C quartet for Tte, the loop 1 C shown in gray). (H) ‘binding core’: PreQ1-loop 2-loop 3-loop 1 PreQ1-C-A-U quartet, and (I) ‘floor’: loop 3-stem 1-loop 3 A-C-G-A quartet. The corresponding residue numbers for Tte WT are given in parentheses. For all structures, residues are colored as follows: P1 (red), P2 (dark blue), L1 (orange), L2 (gold), L3 (green), PreQ1 (magenta). For the PreQ1 binding core, hydrogen is white, nitrogen is blue, oxygen is red, phosphorus is orange, and carbon follows the main color scheme. For ease of comparison, structures are numbered starting with the first nucleotide in P1; note that this differs by two from the numbering used for the NMR structure of Bsu aptamer in references [45, 50].

