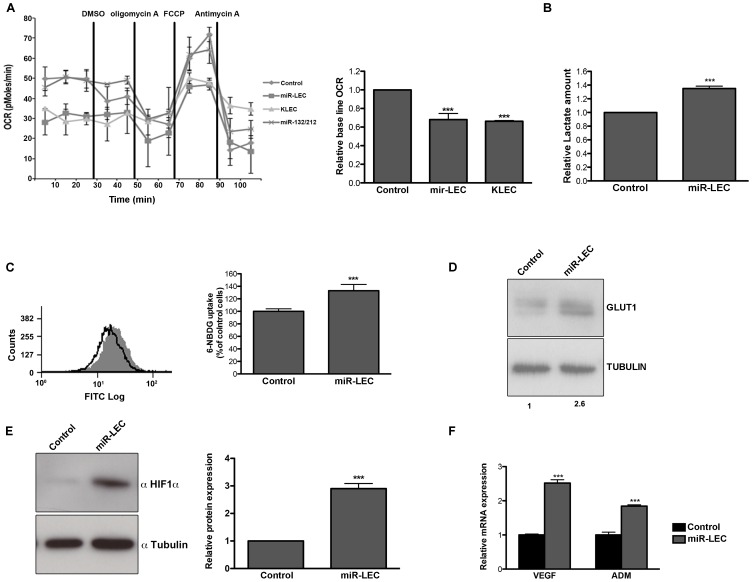
Figure 1. KSHV miRNA cluster induces aerobic glycolysis and stabilizes HIF 1 alpha.
A. Oxygen consumption rate (OCR) in cells expressing a non-targeting control vector or the KSHV miRNA cluster was measured using the Seahorse XF24 Analyser. Cells were seeded at a density of 4×10⁴ cells per well and the assay was performed according to the manufacturer's Mito stress protocol. Uncoupled, maximal and non-mitochondrial respiration was determined after the addition of 5 µM oligomycin, 1 µM carbonyl cyanide 4-(trifluoromethoxy)phenylhydrazone (FCCP) and 2 µM antimycin-A. The bar graph presents the average base line OCR in 3 independent experiments relative to non-targeting control OCR (Mean+SEM, n = 3). B. Lactate levels in the control and miR-LEC culture media. Equal numbers of cells were grown for 24 hours and lactate levels in the media were measured using the MBL Lactate Colorimetric assay kit. The bar graph presents the average ratio between control and miR-LEC from 3 independent experiments (Mean+SEM, n = 3). C. Glucose uptake into control and miR-LEC cell. Control and miR-LEC were incubated with 30 µM of the fluorescent glucose analogue 6-NBDG for 20 minutes prior to analysis by fluorescence-activated cell sorter (FACS). The histogram displays one representative experiment with control shown in black and miR-LEC shown in grey. The bar graph presents the average ratio between the control and miR-LEC from 3 independent experiments (Mean+SEM, n = 3). D. GLUT1 protein expression, as measured by Western blotting, in control or miR-LEC. Values indicate the relative signal of the GLUT1 antibody normalized to α-tubulin as measured using the Odyssey. E. HIF1α protein expression, as measured by Western blotting, in LEC expressing the viral miRNA cluster or the control vector. The bars show relative values of HIF1α antibody intensity normalized to α-tubulin (Mean+SEM, n = 3). F. Expression of the HIF1α target genes VEGF and ADM. mRNA levels were determined by quantitative real-time PCR (qRT-PCR). Tubulin beta (TUBB) levels were used for normalization. In all panels statistical significance denoted by *P<.05; **P<.01; ***P<.001.

