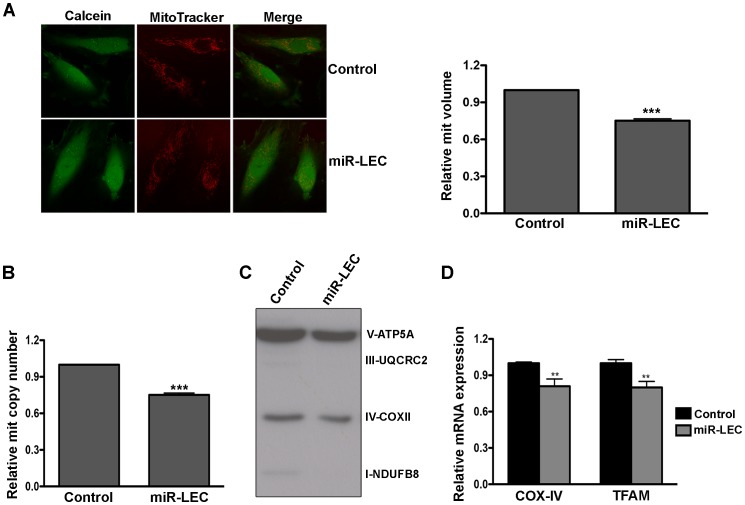
Figure 2. Expression of the KSHV miRNA cluster reduces mitochondrial biogenesis.
A. Mitochondrial volume in miR-LEC. Cells were loaded with 5 µM Calcein-AM and 5 nM MitoTracker Deep Red FM and Z-series of images were. Maximal projections of images were used to quantify the area of green (Calcein) and red (MitoTracker Deep Red) signals as previously described [88]. Representative single-plane images of the mitochondrial structure are shown on the left panel. The bar graph on the right presents the average relative mitochondrial volume in miR-LEC compared to control cells (Mean±SEM, n = 5). B. Mitochondrial DNA (mtDNA) copy number in cells expressing the viral miRNA cluster relative to control cells. qPCR was carried out as described in [89]. C. Expression levels of the 5 OXPHOS complexes as measured by Western blotting analysis using the MitoProfile Total OXPHOS Human WB Antibody Cocktail in miR-LEC and the control cells. In all panels statistical significance denoted by *P<.05; **P<.01; ***P<.001. D. Expression of COXIV and TFAM in cells expressing the KSHV miRNA cluster relative to control cells. mRNA levels were determined by qRT-PCR. TUBB levels were used for normalization.

