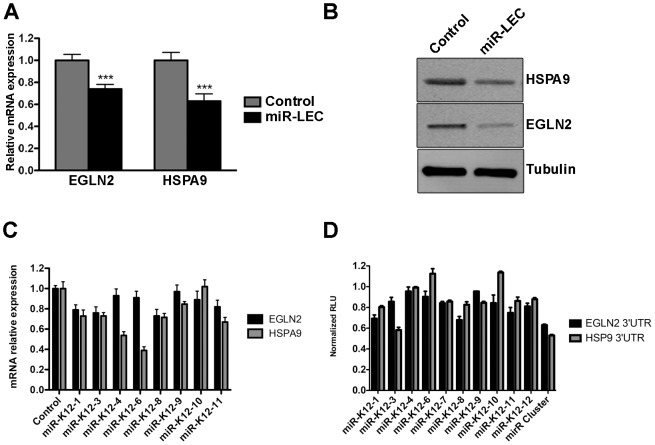
Figure 3. The KSHV miRNA cluster regulates EGLN2 and HSPA9.
A. Relative mRNA levels of EGLN2 and HSPA9 in miR-LEC compared to control cells. mRNA levels were determined by qRT-PCR. TUBB levels were used for normalization. B. Protein levels of EGLN2 and HSPA9 in miR-LEC. Top right panel: protein expression, as measured by Western blotting, in miR-LEC and the control cells. C. Relative mRNA levels of EGLN2 and HSPA9 in LEC expressing the individual KSHV miRNAs. mRNA levels were determined by qRT-PCR. TUBB levels were used for normalization. D. Reporter assay indicating the sensitivity of the EGLN2 or HSPA9 3′UTRs to targeting by the individual KSHV miRNAs. Firefly expression was normalized to Renilla expression to give the relative light units (RLU), which are shown relative to the non-targeting control. In all panels statistical significance denoted by *P<.05; **P<.01; ***P<.001.

