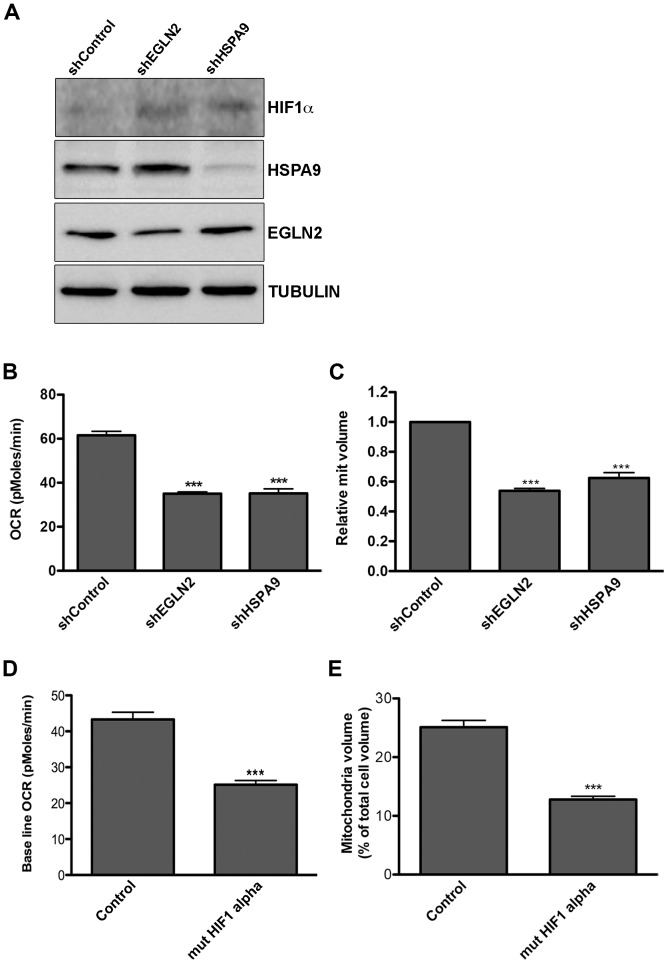
Figure 4. Down regulation of EGLN2 and HSPA9 phenocopies miRNA cluster expression.
A–C. LEC were infected with specific hairpins for EGLN2 and HSPA9 and a non-targeting control (Open Biosystems) and analyzed for: A. Protein expression levels of HIF1α, HSPA9 and EGLN2, as measured by Western blotting; B. Base line OCR (as described in Figure 1A); C. Mitochondrial volume (as described in Figure 2A). D–E. LEC were infected with lentiviruses for HIF1α P402A/P564A (mut HIF1α) and analyzed for base line OCR (D) and mitochondrial volume (E).

