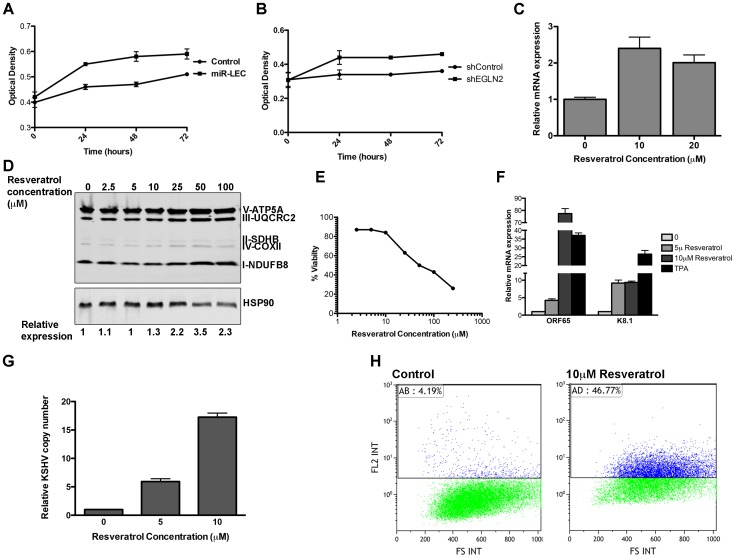
Figure 6. The miRNAs induced metabolic shift enhanced growth under hypoxia and is important for latency maintenance.
A–B. 7500 cells expressing the KSHV miRNA cluster or the control vector (A) and cells expressing the non-targeting control or shEGLN2 (B) were plated in 96 well plates. Cells were fixed after 30 minutes, 24, 48 and 72 hours using 10% Trichloroacetic acid, stained with Sulforhodamine B, and plates were read at 564 nm. Optical density indicates the amount of proteins in the different wells. C. Expression of COXIV in BCBL1 cells treated with in indicated concentration of Resveratrol. mRNA levels were determined by qRT-PCR. TUBB levels were used for normalization. D. Expression of the 5 OXPHOS complexes, as measured by Western blotting analysis using the MitoProfile Total OXPHOS Human WB Antibody Cocktail in BCBL1 cells treated with the indicated concentration of Resveratrol. Values indicate the relative signal of the different antibodies normalized to HSP90 as measured using the ImageQuant software. E. BCBL1 cells were treated with the indicated concentration of Resveratrol for 48 hours. Viability was determined using the Muse Count & Viability Assay Kit on the Muse cell analyzer (Merck Millipore). F. Relative mRNA levels of the KSHV lytic genes ORF65 and K8.1 in BCBL1 cells treated with Resveratrol or TPA for 48 hours. mRNA levels were determined by qRT-PCR. TUBB levels were used for normalization. G. Relative KSHV DNA copy number in 293T cells infected using the growth media of BCBL1 cell treated with the incubated concentration of Resveratrol. H. LEC were infected with rKSHV.219 virus and selected as previously described [71]. Cells were treated with Resveratrol and analyzed by Flow cytometer after 72 hours. The numbers denote the percentage of RFP positive cells, which reflects lytic cells.

