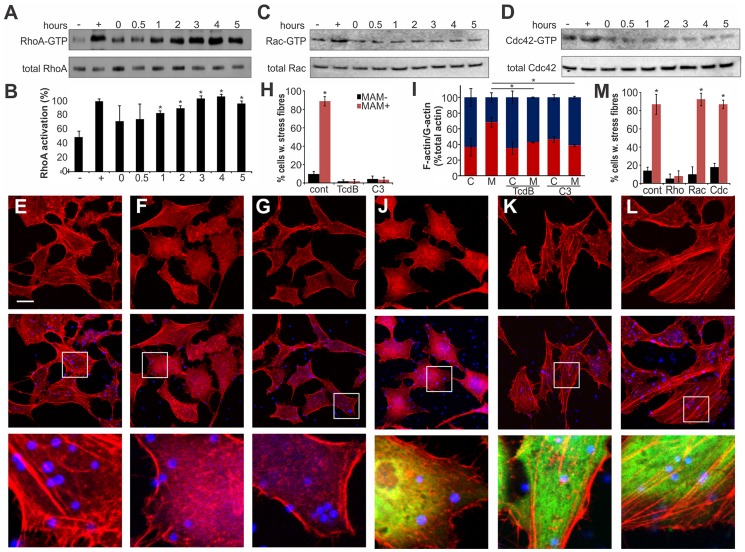
Figure 3. Clustered MAM7 triggeres actin rearrangements through RhoA activation.
Following incubation of Hela cells with bead-MAM7, RhoA-GTP levels were determined and compared to total RhoA levels either immediately, 30 min, 1, 2, 3, 4 and 5 hours following bead attachment (A). RhoA activation in percent (B) was determined from ratios of band intensities of RhoA-GTP/total RhoA, with the positive control (GTPγS-incubated sample) set to 100%. Negative control (−) were cells incubated with bead-coupled GST for 5 hours. Results are means ± standard deviation, n = 3. Data points significantly different from the negative control (p<0.05 as determined by two-tailed unpaired student's t-test) are indicated (*). Experiments described in (A) were repeated to detect activated and total Rac (C) and Cdc42 (D). To test whether GTPase inactivation would affect actin phenotypes, cells were either left untreated (E), treated with TcdB (F) or cell-permeable C3 transferase (G) prior to attachment of bead-MAM7. % cells with stress fibers (H) were determined from image analysis following experiments with untreated (cont), TcdB- or C3-treated cells and attachment of both bead coupled GST-MAM7 (MAM+, red bars) or coupled GST (MAM−, black bars) and data are means ± standard deviation from 12 images (4 frames from n = 3). F-actin/G-actin content was determined from the same samples (C, cont. beads; M, MAM beads) (I). Results are means ± s.e.m. from duplicate experiments and significantly different data are marked (*). Cells transfected with DN EGFP-RhoA (J), DN EGFP-Rac (K) or DN EGFP-DNCdc42 (L) were attached to bead-coupled GST-MAM7 and cells stained with rhodamine-phalloidin. Images shown are of 1 hour post bead attachment and are representative of a set of three experiments. Bar, 10 µm. % cells with stress fibers (M) were determined from image analysis following experiments on cells transfected with pcDNA3-EGFP (cont), DN RhoA, DN Rac or DN Cdc42 and attachment of both bead coupled GST-MAM7 (MAM+, red bars) or coupled GST (MAM−, black bars) and data shown are means ± standard deviation from 12 images (4 frames from n = 3).

