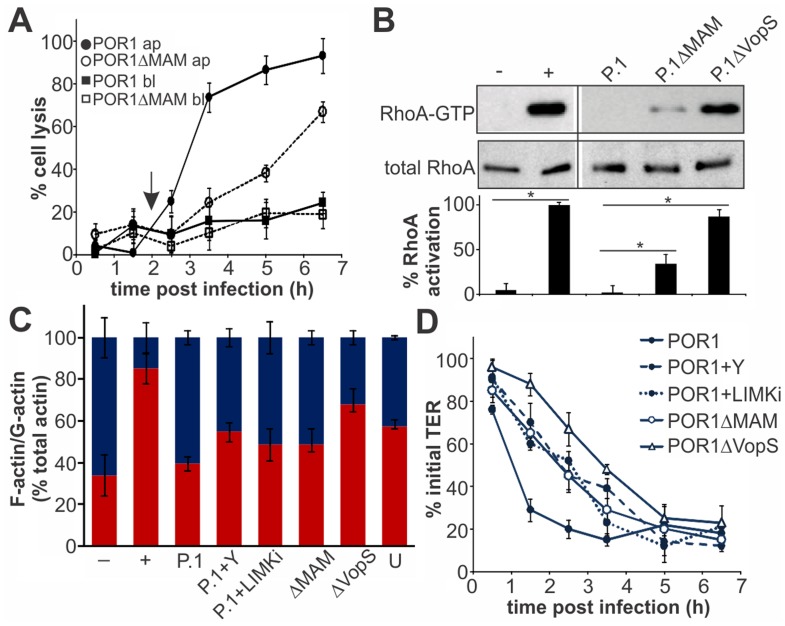
Figure 7. MAM function accelerates T3SS1-mediated lysis of polarized epithelial cells.
Cell lysis (A) was determined following infection of Caco-2 layers with POR1 apically (black circles) or basolaterally (black squares) or POR1ΔMAM apically (white circles) or basolaterally (white squares). Results were normalized to Triton-induced cell lysis (100%) and uninfected cells (0%). Arrow (2 hrs) indicates time point chosen for experiments shown in (B) and (C). Data shown are means ± standard deviation (n = 3). Polarized Caco-2 layers were infected with POR1 (P.1), POR1ΔMAM or POR1ΔVopS for 2 hrs and Rho activation levels were determined as the ratio of band intensities from RhoA-GTP and total RhoA (and normalized to GTPγS-treated lysate, (+, 100% activation). Neg. control (−): GDP-treated lysate. Statistical significance is indicated (*, n = 2), (B). F-actin and G-actin content was determined in polarized Caco-2 monolayers after serum starvation (−), treatment with F-actin enhancing solution (+), infection with POR1, POR1 after treatment with Y-27632 (P.1+Y), with LIMK inhibitor (P.1+LIMKi) or infected with POR1ΔMAM or POR1ΔVopS for 2 hrs, or on untreated cells (U). Results are means ± s.e.m. (n = 2), (C). Transepithelial electrical resistance (TER) was measured on polarized Caco-2 layers infected with POR1, POR1 after treatment with Y-27632 or after treatment with LIMK inhibitor or infected with POR1ΔMAM or POR1ΔVopS (D) and normalized to basal TER prior to infection (100%). Results are means ± standard deviation (n = 3).

