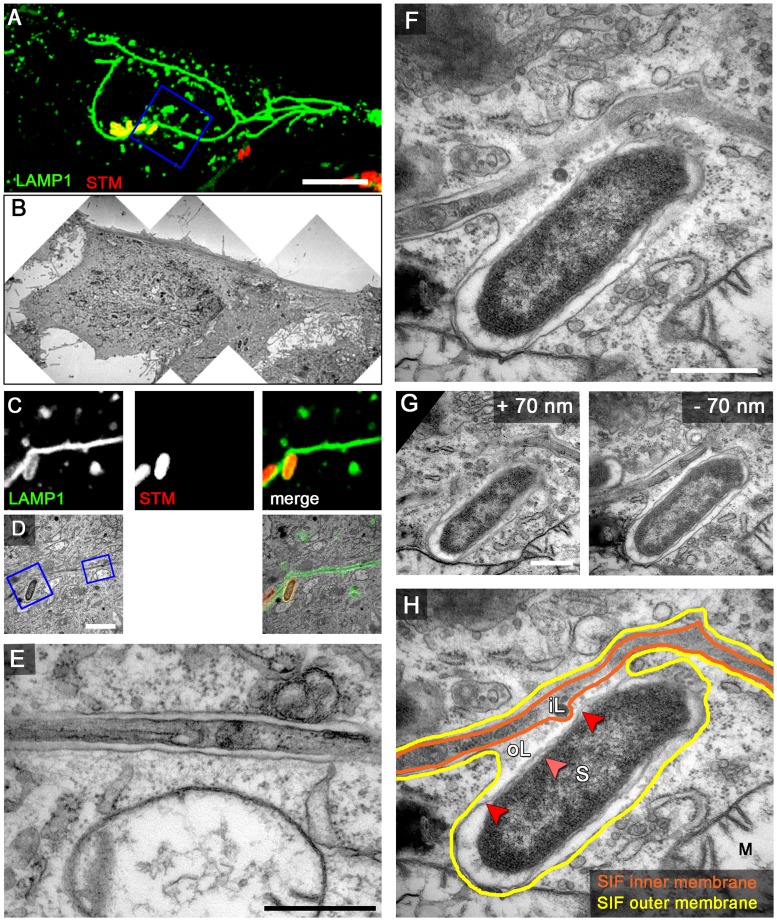
Figure 4. LAMP1-GFP-positive SIF display a double membrane at 8 h p.i.
HeLa cells expressing LAMP1-GFP (green) were seeded in Petri dishes with a gridded coverslip and infected with Salmonella expressing mCherry (STM, red). Live cell imaging was performed 8 h p.i. to visualize LAMP1-GFP-positive SIF (A, maximum intensity projection [MIP], C, single Z plane). Subsequently, the cells were fixed and processed for CLEM to reveal the ultrastructure of selected cells. Several low magnification images were stitched to visualize the cell morphology (B). Higher magnification images were used to align LM and TEM images (D). Details of a LAMP1-GFP-positive double membrane SIF (E) and an SCV linked to a SIF (F, G) are shown. G) Two additional ultrathin sections show the membrane organization of the SCV and SIF in detail F). H) The inner and outer membrane of a SIF and SCV are outlined in orange and yellow, respectively. Light and dark red arrowheads indicate inner and outer membrane of the Salmonella cell envelope, respectively. Labels: S, Salmonella; M, mitochondria; iL, inner lumen; oL, outer lumen. A cell representative for 10 biological replicates is shown (1–3 technical replicates with each 2–4 cells). Scale bars: 10 µm (A, B), 2 µm (C, D), 500 nm (E, F, G).

