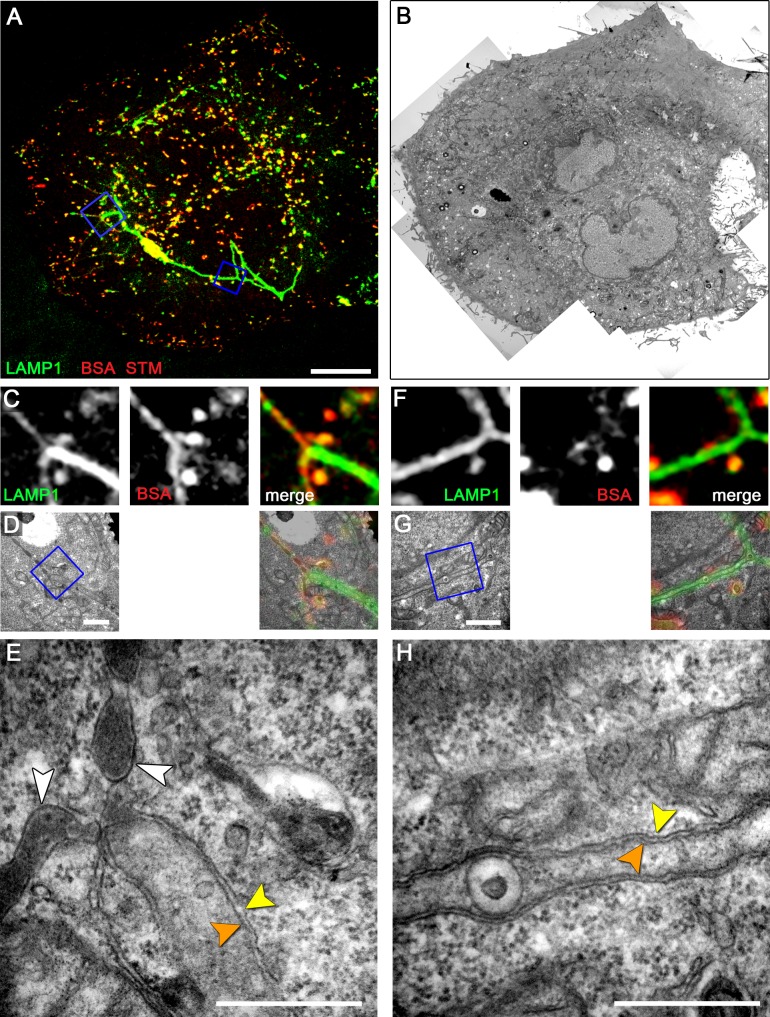
Figure 5. Early-stage SIF in HeLa cells exhibit leading and trailing phenotypes.
HeLa expressing LAMP1-GFP (green) were seeded on a Petri dish with gridded coverslip and infected with Salmonella WT expressing mCherry (STM, red). After infection, cells were pulse-chased with BSA-Rhodamine (red) 1–3 h p.i. Live cell imaging was performed 4 h p.i. to visualize LAMP1-GFP-positive SIF (A, MIP; C, F, single Z plane). Subsequently, the cells were fixed and processed for CLEM. Several low magnification images were stitched to visualize the cell morphology (B). C–H) CLEM of ROIs showing SIF of various diameter (D, E), and a double membrane SIF with an internal vesicle (G, H). E) A tubular compartment showing the transition from a leading SIF with a single membrane and endosomal content to a trailing SIF with a double membrane and cytosolic content. H) Double membrane SIF with luminal membrane vesicle. Orange and yellow arrowheads indicate inner and outer membranes if double membrane SIF, respectively. The white arrowheads indicate single membrane SIF. A cell representative for three biological replicates is shown (1–3 technical replicates with each 2–4 cells). Scale bars: 10 µm (A, B), 1 µm (C, D, E, G), 500 nm (E, H).

