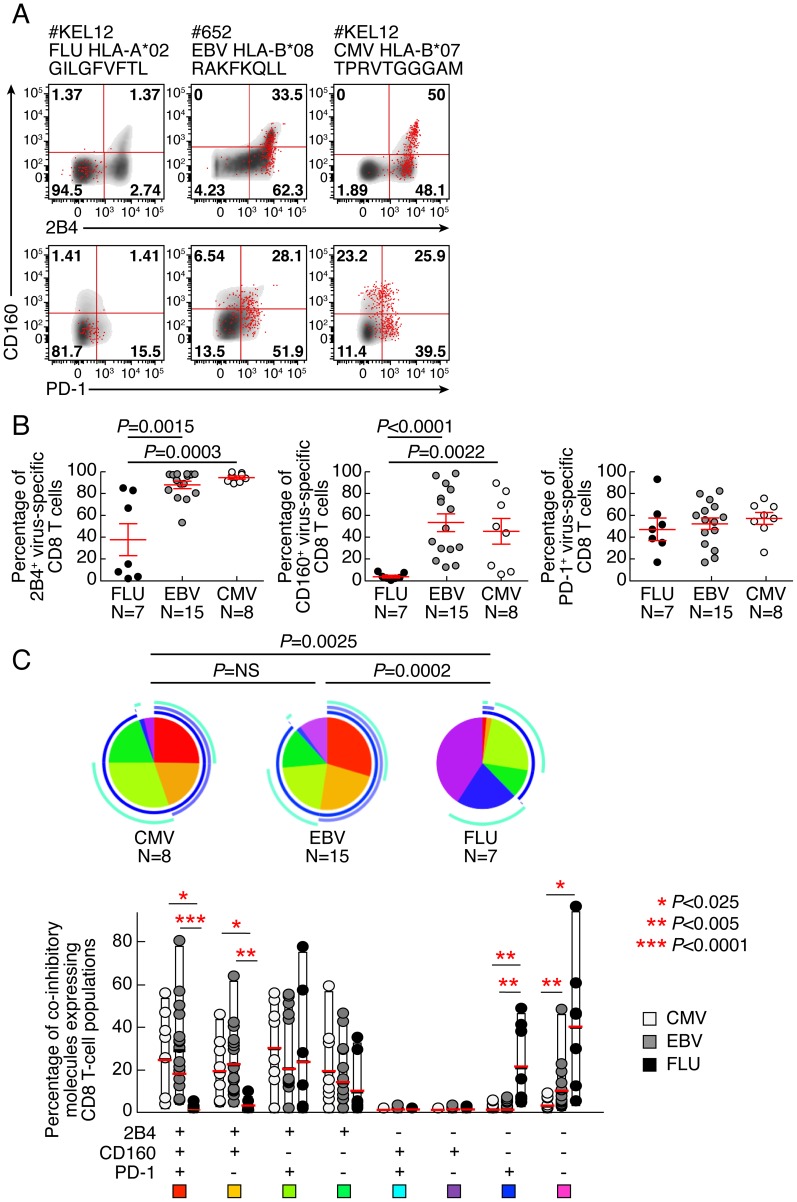
Figure 1. EBV and CMV-specific CD8 T cells express significantly more CD160 than Flu-specific CD8 T cells.
Flow cytometric profiles of Flu, EBV and CMV-specific CD8 T cells expressing PD-1, CD160 and 2B4 ex vivo. The expression profiles of CD8 T cells were performed in 22 individuals using polychromatic flow cytometry. (A) 2B4, CD160 and PD-1 expression profiles of Flu, EBV and CMV-specific CD8 T cells detected by multimer staining (red) as compared to total CD8 T cells (black/grey) of three representative individuals (#KEL12 FLU HLA-A*02 GILGFVFTL, #652 EBV HLA-B*08 RAKFKQLL and #KEL12 CMV HLA-B*07 TPRVTGGGAM, respectively). (B) Frequencies of Flu, EBV and CMV-specific CD8 T cells expressing 2B4, CD160, PD-1. Red bars correspond to mean ± SEM. Statistical significance (P values) in panel B were obtained using One-way ANOVA (Kruskal-Wallis test) followed by a unpaired Student's t-test. (C) Expression profiles of 2B4, CD160, PD-1 of CMV, EBV and Flu-specific CD8 T cells. All the possible combinations of 2B4, CD160 and PD-1 expression are shown on the x axis and frequencies of 2B4, CD160 and PD-1 expression on CD8 and T-cell populations are shown on the y axis. Combinations of expression are grouped and color-coded on the basis of the number of molecules expressed. The pie chart summarizes the data, and each slice corresponds to the fraction of T cells expressing a given combination of molecules within the CD8 T-cell populations. Bars correspond to the fractions of distinct T-cell populations within the total T cells. Stars indicate statistical significance (*:P<0.025; **:P<0,005; ***:P<0.0001) and were calculated using the SPICE software.

