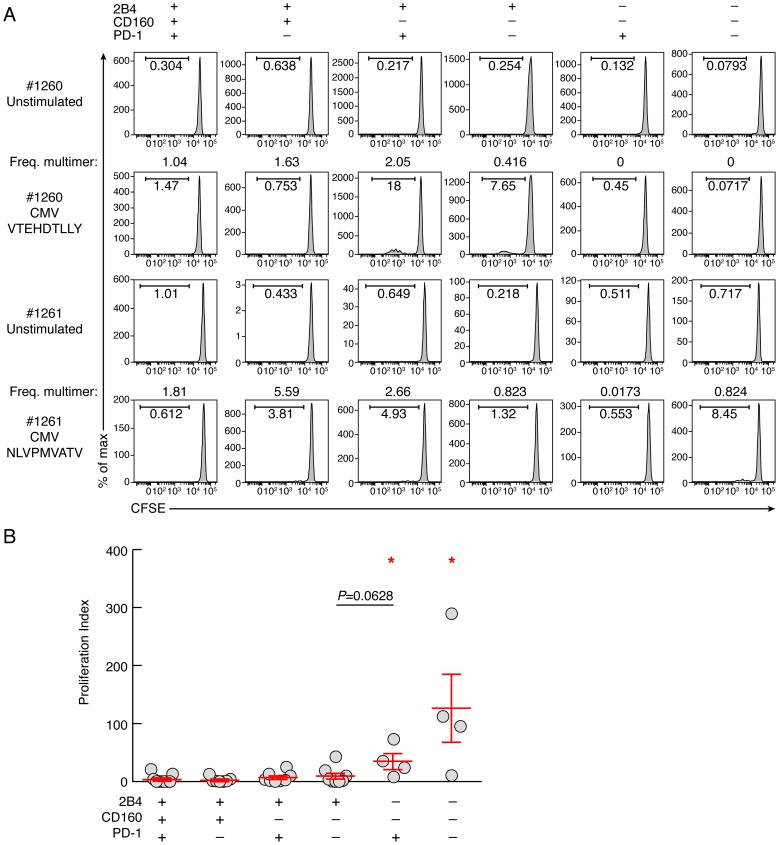
Figure 3. Proliferative capacity virus-specific CD8 T-cell populations is influenced by co-inhibitory molecule expression.
CD8 T-cell populations were sorted on the basis of 2B4, PD-1 and CD160 expression, labeled with CFSE and stimulated with (viral) peptides in the presence of autologous irradiated CD8-depleted PBMCs (ratio CD8/feeder cells 1∶10) for 6 days (n = 11). (A) Representative CMV (#1260 CMV HLA-A*01 VTEHDTLLY) and CMV (#1261 CMV HLA-A*02 NLVPMVATV) specific CD8 T-cell proliferation capacity assessed by CFSE based assay. (B) Proliferation index (CFSElow CD8 T-cell frequency/Multimer-specific CD8 T-cell frequency) of virus-specific CD8 T cells. Red bars correspond to mean ± SEM. Red stars indicate statistical significance (P<0.05). Statistical significance (P values) in panel B was obtained using One-way ANOVA (Kruskal-Wallis test) followed by a Student's t-test.

