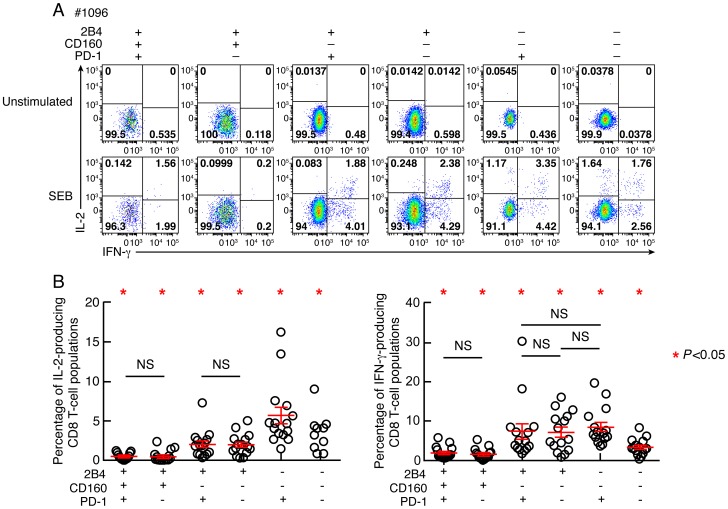
Figure 5. Relative capacity of CD8 T-cell subsets defined by 2B4, CD160 and PD-1 expression to produce IL-2 and IFN-γ.
CD8 T-cell responses were analyzed within six CD8 T-cell subsets defined by 2B4, CD160 and/or PD-1 expression. (A) Representative flow cytometric profiles of CD8 T cells producing IL-2 and/or IFN-γ following stimulation of total blood mononuclear cells with SEB in Subject #1096. Unstimulated cells (negative control) are also shown. (B) Frequencies of IL-2 and IFN-γ-producing CD8 T-cell populations. Red bars correspond to mean ± SEM. Red stars indicate statistical significance (P<0.05). NS: not significant. Statistical significance (P values) in panels A and B were obtained using One-way ANOVA (Kruskal-Wallis test) followed by a paired Student's t-test.

