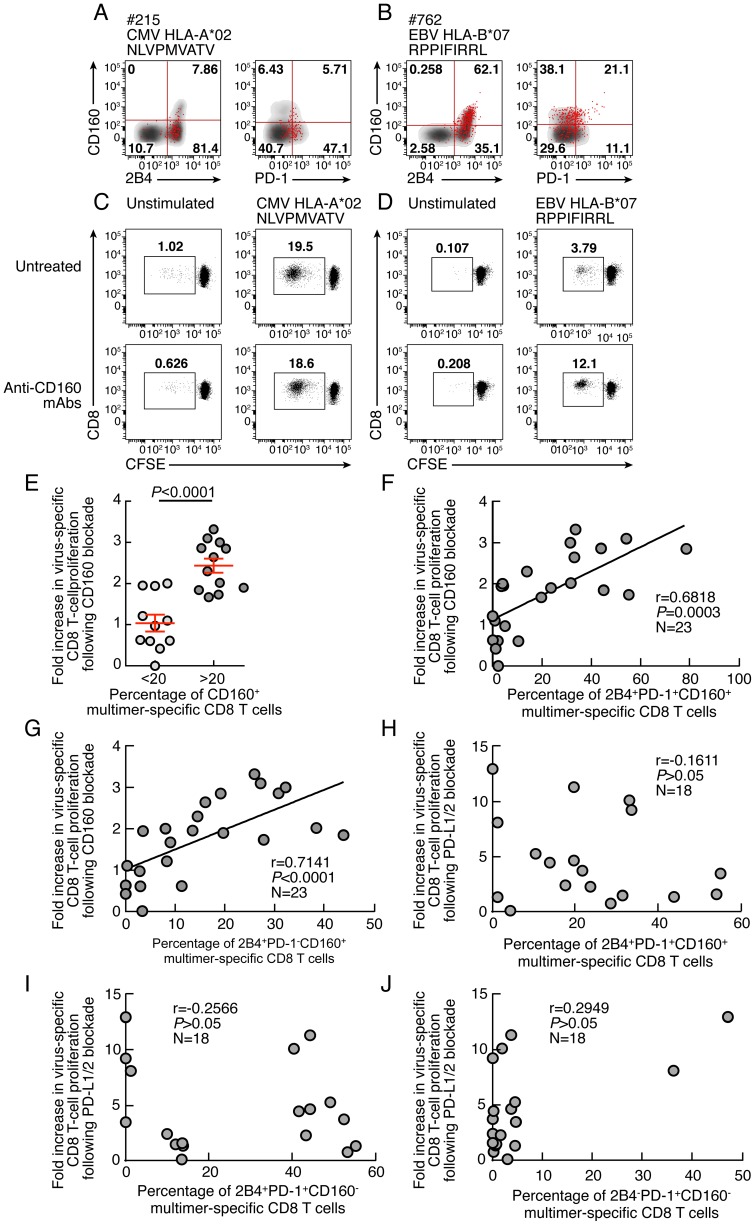
Figure 9. Restoration of CD8 T-cell proliferation by CD160/CD160-ligand blockade directly correlates with the level of the ex vivo CD160 expression.
(A–B) Representative flow cytometric profile of 2B4, CD160 and PD-1 expression of CMV (#215 CMV HLA-A*02 NLVPMVATV) and EBV (#762 EBV HLA-B*07 RPPIFIRRL)-specific CD8 T cells detected by multimer staining (red) compared with total CD8 T cells (black/grey). (C–D) Representative examples of CMV (#215 CMV HLA-A*02 NLVPMVATV) and EBV (#762 EBV HLA-B*07 RPPIFIRRL)-specific CD8 T-cell proliferation in presence or not of anti-CD160 mAbs assessed by CFSE-based assay. (E) Impact of CD160 expression on the restoration of CD8 T-cell proliferation by CD160/CD160-ligand blockade. (F–G) Correlation between fold increase in proliferation capacity (y axes) upon CD160 blockage and percentage of 2B4+CD160+PD-1+ or 2B4+CD160+PD-1− virus-specific CD8 T cells. (H–J) Correlation between fold increase in proliferation capacity (y axes) upon PDL-1/2 blockage and percentage of 2B4+CD160+PD-1+, 2B4+CD160−PD-1+ or 2B4−CD160−PD-1+ virus-specific CD8 T cells (x axes). Statistical significance (P values) in B–I were obtained using Spearman's rank correlations.

