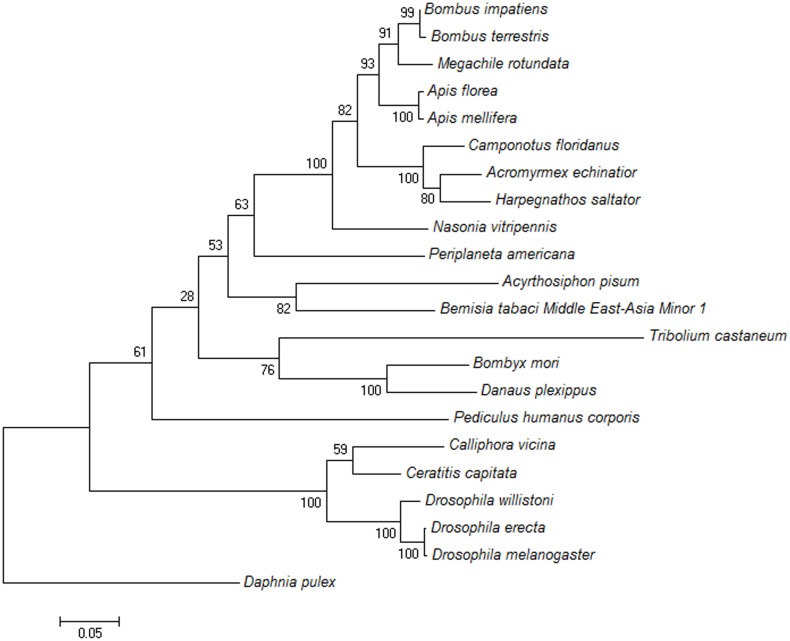
Figure 4. A phylogenetic tree based on the known amino acid sequences of TRP genes.
The phylogenetic tree was generated via Maximum Likelihood method based on the poisson correction mode, and this tree was used to determine the relationships between different insects. The numbers above the branches indicate the percentages of bootstrap replicates in which each species was grouped together. The scale bar indicates the number of substitutions per site for each unit branch length. The bootstrap values of 1000 replicates are displayed for each branch. TRP from insects of the same order were clustered into the same group, which is consistent with traditional taxonomy. Bombus terrestris (XP_003402180.1); Bombus impatiens (XP_003489572.1); Megachile rotundata (XP_003705368.1); Apis mellifera (XP_003489572.1); Apis florea (XP_003696373.1); Camponotus floridanus (EFN73452.1); Harpegnathos saltator (EFN82264.1); Acromyrmex echinatior (EGI64238.1); Nasonia vitripennis (XP_001605329.1); Periplaneta Americana (AGG86916.1); Acyrthosiphon pisum (XP_003240303.1); Ceratitis capitata (XP_004536899.1); Calliphora vicina (CAB02410.1); Drosophila willistoni (XP_002073367.1); Drosophila melanogaster (NP_476768.1); Drosophila erecta (XP_001981285.1); Pediculus humanus corporis (XP_002423380.1); Tribolium castaneum (XP_968670.2); Danaus plexippus (EHJ65374.1); Bombyx mori (XP_004922653.1); Daphnia pulex (EFX85740.1).

