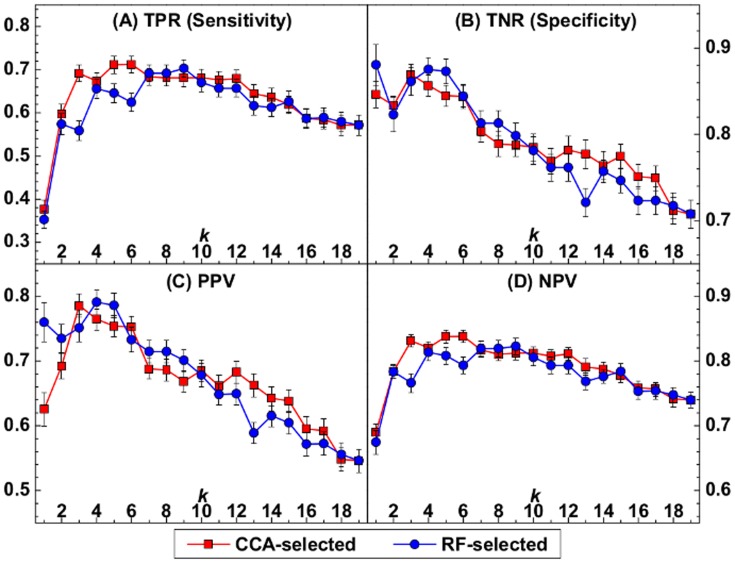
Figure 2. Prediction measures obtained from the Support Vector Machine (SVM) using the  -combinations selected by the Canonical Correlation Analysis (CCA) and Random Forests (RF) methods.
The prediction measures (A) true positive rate (TPR), (B) true negative rate (TNR), (C) positive predictive value (PPV), and (D) negative predictive value (NPV) are shown for each step  . For each
  , a SVM ensemble with bagging is constructed based on the CCA- and RF-selected subset of biomarkers.

