
Figure 4. The effect of inositols on IAPP amyloid formation depends on their stereochemistry.
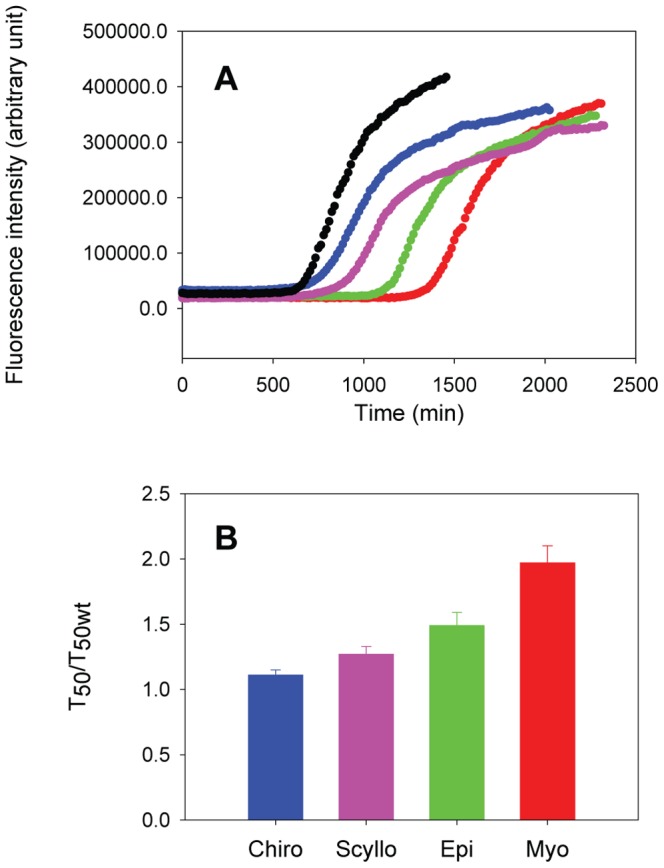
(A) Kinetic curves of amyloid formation by IAPP and mixtures of IAPP with inositol stereoisomers as monitored by thioflavin-T fluorescence assays. Black, IAPP; red, IAPP + myo-inositol; green, IAPP + epi-inositol; purple, IAPP + scyllo-inositol; blue, IAPP + chiro-inositol. (B) A bar graph comparing the effects of the different inositols on the value of T50. Data is plotted as T50 normalized by the T50 of IAPP in the absence of any compounds. Error bars represent standard deviations for three repeats. The concentration of IAPP was 16 µM. The IAPP to inositol ratio was 1 to 20 by weight in each mixture. The experiments were conducted in 20 mM Tris-HCl (pH 7.4), without stirring at 25°C.