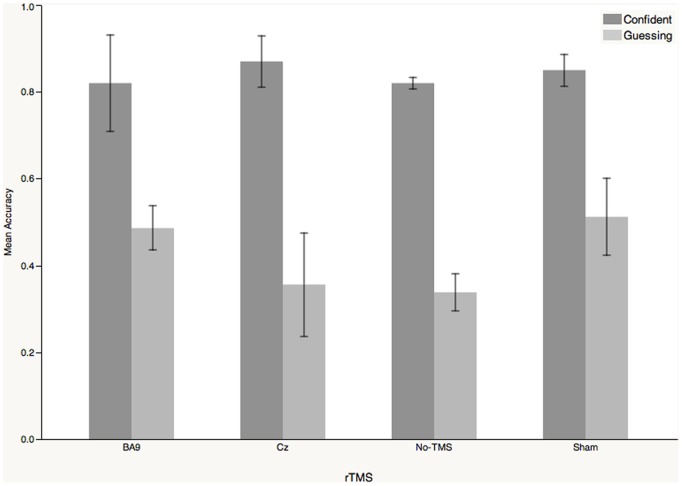
Figure 3. The distribution of accuracy in the rTMS experiment, grouped both by the factor of confident or guessed responses and by stimulation site.
The error bar of each column indicates the standard error of the data. The accuracies of the guessed trials among the four stimulation sites were similar, all at the chance level (the non-linear mixed effect model was adopted, rTMS on BA9 versus no-TMS, t4 = 1.64, p = 0.1768; sham TMS on BA9 versus no-TMS, t4 = 0.57, p = 0.5980; rTMS on Cz versus no-TMS, t4 = 0.67, p = 0.5378).

