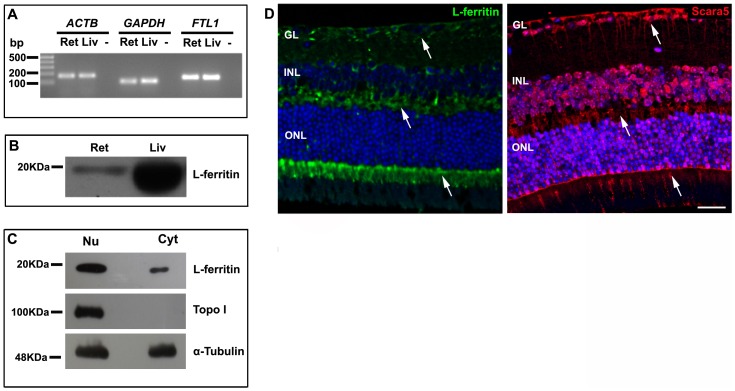
Figure 5. L-ferritin expression in mouse retina.
A: The expression of FTL1 mRNA in the retina was evaluated by q-RT-PCR. Agarose gel electrophoresis of q-RT-PCR products confirmed that FTL1 single amplicon with 144 bp was generated. ACTB and GAPDH were used as housekeeping genes. B: Western blotting analysis showed a specific band with a molecular weight of 19 KDa, confirming the presence of L-ferritin in the retina. α-tubulin was used as a loading control. C: Analysis of nuclear and cytoplasmic protein fractions samples showed that L-ferritin was present in both cellular compartments. α-tubulin was used as a loading control. Topo I was used to assure that nuclear protein was not present in the cytoplasmic fraction sample. D: As expected, L-ferritin immunolabeling distribution pattern (arrows) was in accordance with the Scara5 signal (arrows) in paraffin-embedded retinal sections. Ret, retina; Liv, liver; -, no-template control; GL, ganglion cell layer; INL, inner nuclear layer; ONL, outer nuclear layer. Scale bar: 29 µm.

