
Figure 3.
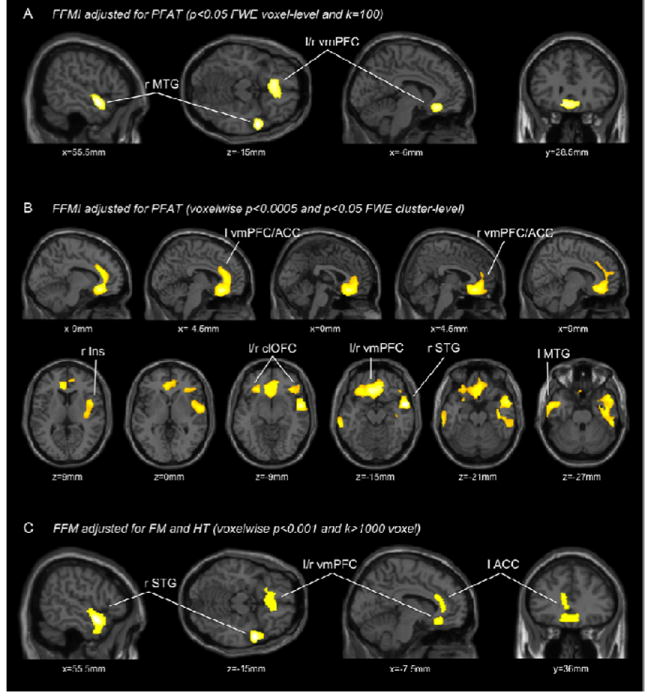
T-score maps of regional GMV negatively associated with FFMI adjusted for PFAT (2A,C) and FFM adjusted for FM and height (2C); 2A is thresholded at a significance level of P<0.05, FWE corrected for multiple comparisons on the voxel-level and an extent threshold of 100 continuous voxels; 2B thresholded at p<0.05, FWE cluster-level corrected with a voxelwise threshold of p<0.005; 2C is thresholded at uncorrected p<0.001 and an extent threshold 1000 continuous voxels; corresponding locations in the stereotactic space are indicated below each section; l left; r right; MTG middle temporal gyrus; vmPFC ventromedial prefrontal cortex; ACC anterior cingulate; Ins Insula; clOFC caudolateral orbitofrontal cortex; STG superior temporal gyrus;