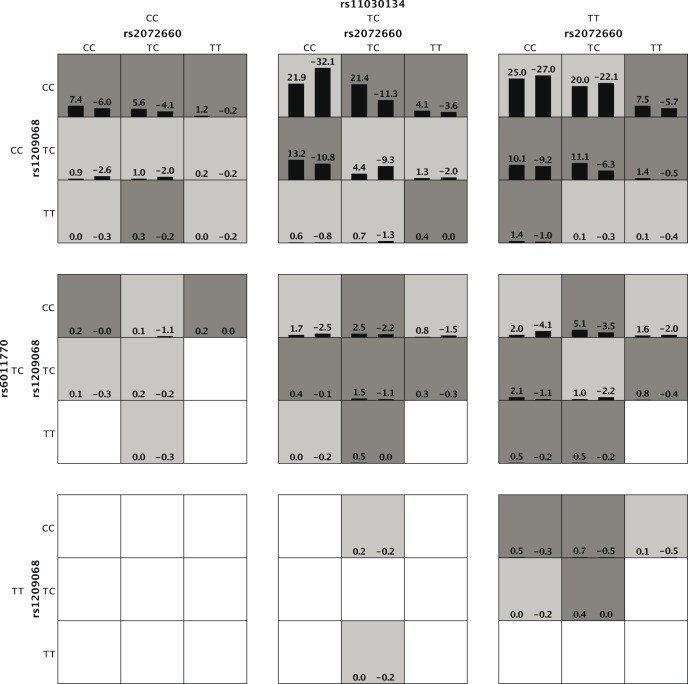
Figure 4. The interaction pattern among rs2072660-rs1209068-rs11030134-rs6011770.
The left bar in each nonempty cell denotes a positive score and the right bar a negative score. High-risk cells are indicated by dark shading, low-risk cells by light shading, and empty cells by no shading. Note that the patterns of high-risk and low-risk cells differ across each of the different multilocus dimensions, presenting evidence of epistasis.

