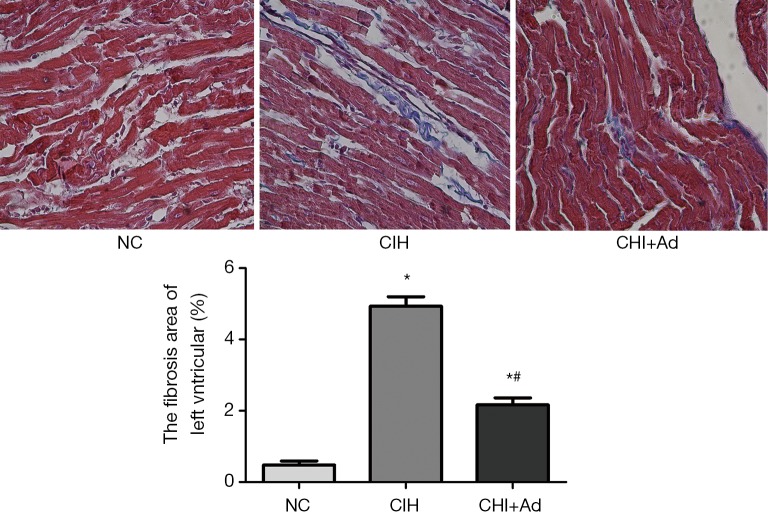
Figure 1.
The Masson analysis of the left ventricular. The blue represented the fibrosis and the red represented the normal myocardium. *P<0.01 versus NC group; #P<0.05 versus CIH; NC, normal control; CIH, chronic intermittent hypoxia; CIH + Ad, chronic intermittent hypoxia and adiponectin supplement.

