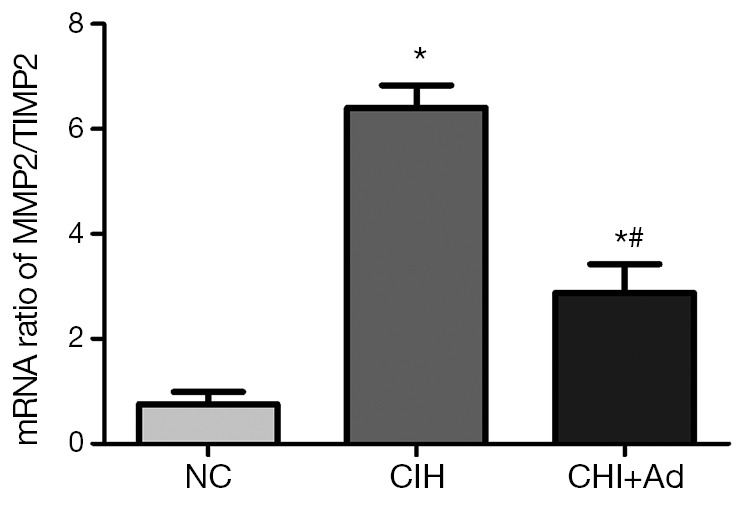
Figure 3.

The ratio of mRNA levels of MMP2 and TIMP2. The mRNA expressions of MMP2/TIMP2 in heart of three groups; PCR fluorescent signals for MMP2, TIMP2 were standardized to PCR fluorescent signals obtained from an endogenous reference (β-actin). *P<0.01 versus NC group; #P<0.05 versus CIH. NC, normal control; CIH, chronic intermittent hypoxia.
