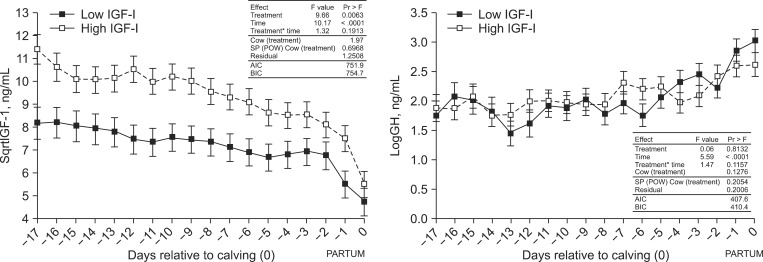
Fig. 1.
IGF-I and GH plasma concentrations in cows. The IGF-I values were square root transformed (sqrtlIGF-I). GH values were logarithmic transformed (logGH). The table presents results of the mixed-model ANOVA with a covariance structure matrix spatial power and the random effect [SP(POW)+RE]. Data are expressed as the last square means ± SE. BIC: Bayesian-Schwarz information criterion, AIC: Akaike information criterion.

