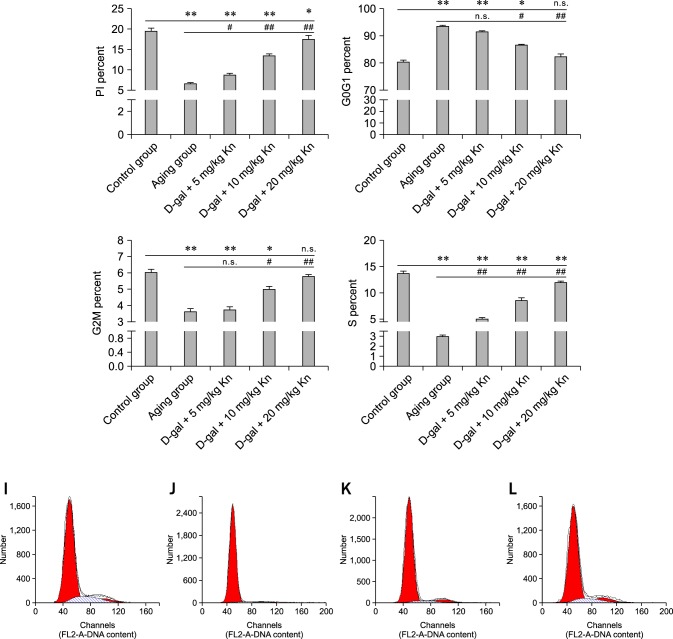
Fig. 5.
Changes in the cell cycle and PI values for each group. The percentage of PI, G2M, and S phases in spleen lymphocytes and G0G1 (*p < 0.05; **p < 0.01; n.s., not significant, respectively). Spleen lymphocytes (I) in the control group with a higher percentage of cells in the G2M and S phase. (J) In the aging group, there were reduced proportions of cells in the G2M and S phases. (K) Treatment with the middle Kn dose increased the proportion of cells in the G2M and S phases. (L) The high Kn dose significantly increased the proportion of cells in the G2M and S phases.

