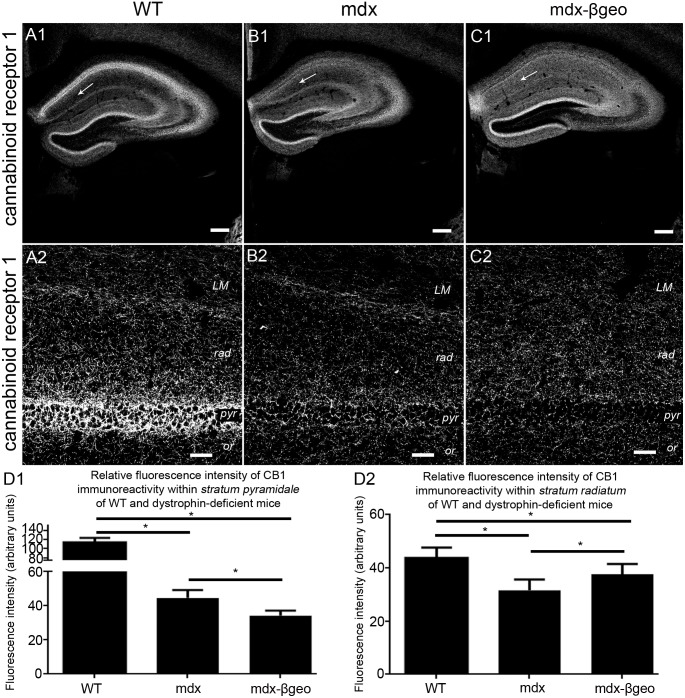
Figure 3. Localisation and quantification of CB1 immunoreactivity within the hippocampus of WT and dystrophin-deficient mice, reacted and imaged under identical conditions.
(A) shows the pattern of CB1 immunoreactivity within the hippocampus of WT mouse tissue. (A 1) an overview of the entire hippocampus demonstrating the prototypical enrichment of VGAT immunoreactivity within the cell body regions of the hippocampus compared to one of the dendritic regions (arrow). (A 2) a magnified view of the CA1 sub-field confirming the enrichment of CB1 immunoreactivity in stratum pyramidale compared with the dendritic regions. (B) and (C) show the pattern of CB1 immunoreactivity within the hippocampus of mdx and mdxβgeo mouse tissue respectively, reacted and imaged under conditions identical to those for the WT tissue. Note the significant level of signal within the dendritic layers, particularly in mdxβgeo mouse tissue (arrow). Whilst the enrichment within (B 2, C 2) stratum pyramidale is still evident, the level of signal is significantly lower compared to WT. (D 1) quantification of the intensity of CB1 immunoreactivity within stratum pyramidale of WT, mdx and mdxβgeo tissue. (D 2) quantification of the intensity of CB1 immunoreactivity in the stratum radiatum of WT, mdx and mdxβgeo tissue. Bars represent the means and lines the SEM. *P<0.05; ANOVA with Tukey’s posthoc test; N = 3 animals. Scale bars (A1, B1, C1) 200 µm; (A2, B2, C2) 40 µm.

