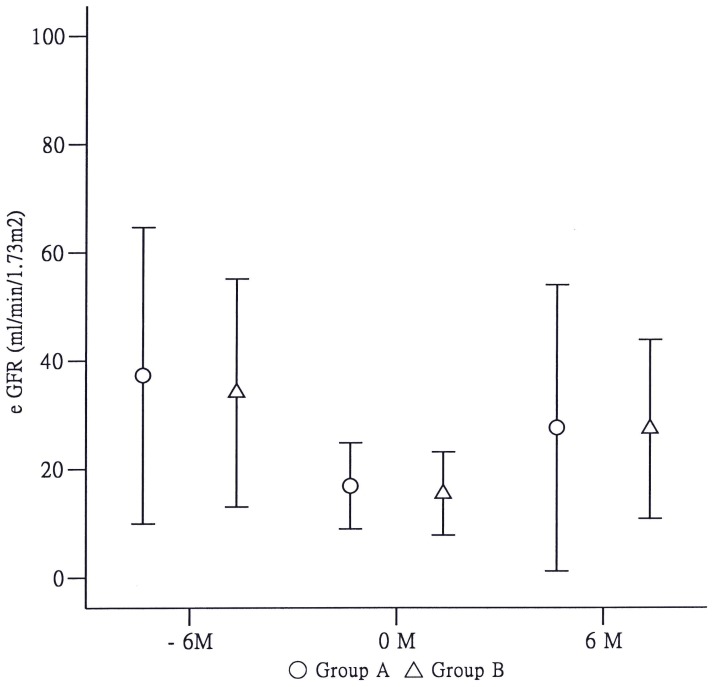
Figure 2. Changes in estimated glomerular filtration rate (eGFR) over time within the early- and late-recovery groups.
T (0) represents the time point on admission from urinary tract infection; the “plus” and “minus” symbols represent the time interval after and before admission, respectively. Acute kidney injury occurred in diabetic patients with chronic kidney disease [eGFR at T (0) versus T (−6); p = 0.007 in Group A; p = 0.001 in Group B], and eGFR reverted to the trend 6 months later if urinary tract infection was cured.

