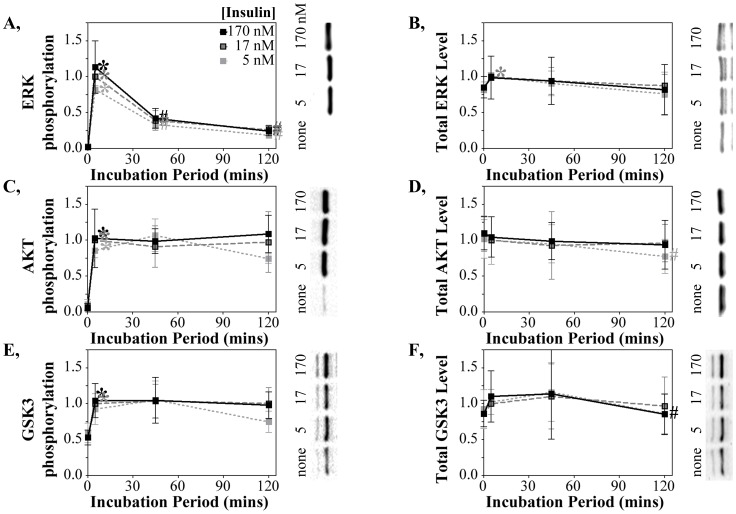
Figure 2. Differential down-regulation of downstream signaling pathways following chronic insulin stimulation.
(A) phospho-ERK, (B) total ERK (C) phospho-AKT, (D) total AKT, (E) phospho-GSKβ, and (F) total GSKβ proteins quantified by western blot using the same extracts analyzed in figure 1. The fluorescence intensities of pERK and ERK, or pGSK and GSK, were quantified on the same blot with the phospho-specific and total protein antibodies (of rabbit and mouse origin) conjugated to specific-specific secondary antibodies with distinguishable fluorophores. The pAKT and total AKT antibodies both originated from rabbits and were probed in separate blots. Data normalization, number of studies, symbols and representative westerns are as described in figure 1.

