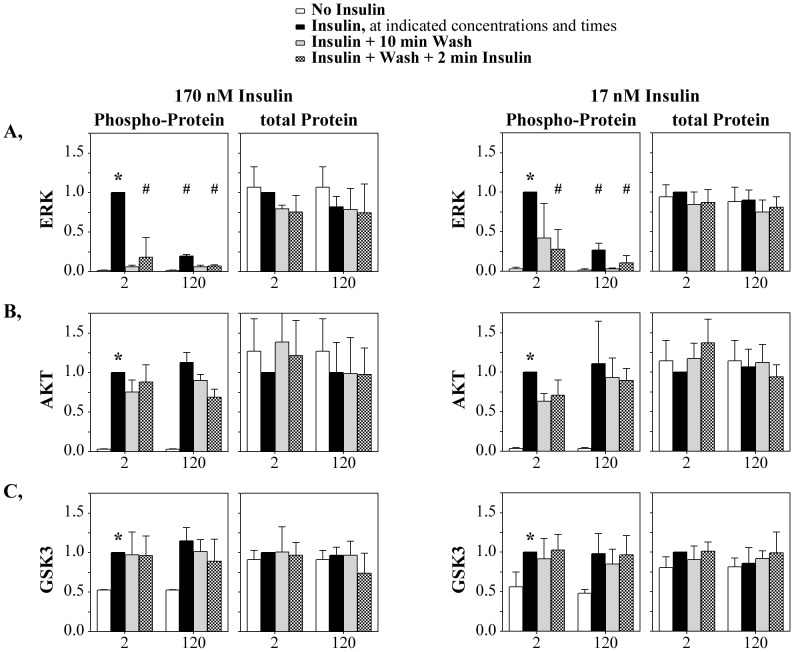
Figure 4. Differential impact of re-stimulation on pathways downstream of the IR.
(A) pERK, (B) total ERK, (C) pAKT, (D) total AKT (E) pGSKβ and (F) total GSKβ proteins quantified by western blot in response to repeated insulin stimulation. See Fig. 2 for measurement details. Data are represented as mean ± SD from three (170 nM) and four (17 nM) independent studies. Data normalization and symbols are as described in figure 1.

