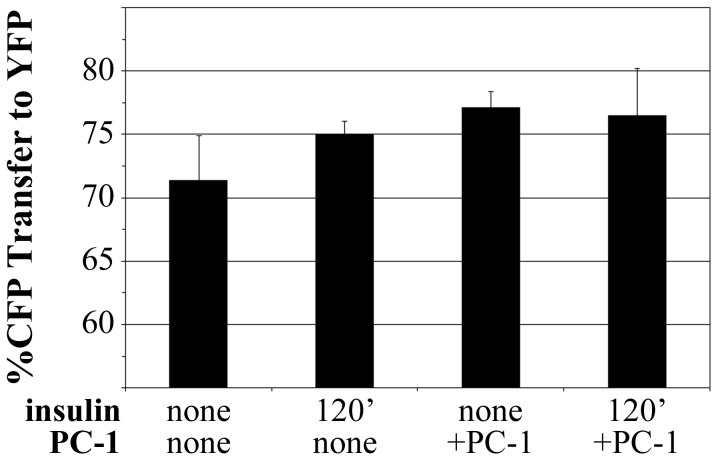
Figure 8. IR-CFP-YFP structure induced by chronic insulin exposure is similar to that induced by expression of PC-1.
FRET levels of the IR-CFP-YFP probe transiently expressed in CHO cells or in CHO cells stably overexpressing PC-1. Measurements are conducted prior to insulin treatment or after chronic (120′) insulin exposure (n = 3 independent studies). Data represent the mean ± sd of the average FRET measurements of an average of 27 cells per point in each of three independent studies.

