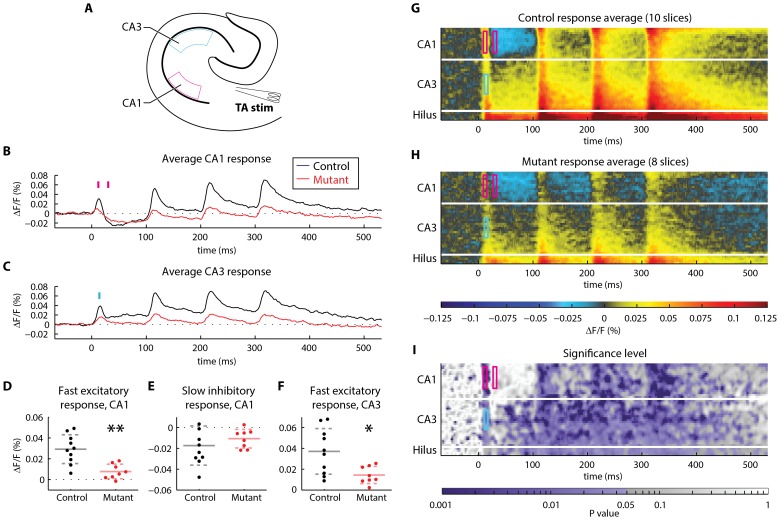
Figure 5. Spatiotemporal analysis, compared to conventional analysis, of the response to temporoammonic pathway stimulation in mutant (n = 8) and control (n = 10) slices.
(Same data as in Figure 2 .) (A) In the first step of conventional VSDI analysis, a temporal signal is obtained for a region of interest (ROI) by averaging the data across a cluster of pixels and over a time interval of interest. Here, we have selected two regions: CA1 stratum radiatum and CA3 stratum radiatum. (B) The average response in the CA1 stratum radiatum ROI to four, 10 Hz stimuli delivered to the temporoammonic pathway in mutant (red) and control (black) slices in CA1 stratum radiatum. Conventional analysis proceeds by identifying time intervals of interest in these data. Here, we have chosen time intervals corresponding to the fast excitatory postsynaptic potential (EPSP) and the slow inhibitory hyperpolarization that follows the stimulus. Both of these time intervals are marked with magenta bars and these intervals are 6 ms long (3 camera frames at 500 frames per second). (C) The average response in the CA3 stratum radiatum ROI, in the same recordings of mutant and control slices. We have chosen to analyze the time interval corresponding to the fast EPSP for analysis in CA3; this 6 ms-long interval is marked with a cyan bar. (D–F) Traditional (ROI-based) statistical comparison of voltage-sensitive fluorescence in mutant and control slices in (D) CA1 during the fast EPSP, (E) CA1 during the slow inhibitory response, and (F) CA3 during the fast EPSP. Significant differences were observed in the fast EPSP in CA1 and in the fast EPSP in CA3 (t-test; ** P<0.01, * P<0.05; solid and dashed lines indicate mean±standard deviation). No significant difference was observed in the slow inhibitory response in CA1. (G–H) Rasters of average activity in (G) control and (H) mutant slices. Visual inspection suggests that activity is qualitatively different between groups across many sites. (I) Heatmap showing sites of significantly different spatiotemporal activity that were identified by the permutation test. The spatiotemporal sites that were analyzed using conventional VSDI analysis (described in A–F) are outlined in CA1 (magenta) and CA3 (cyan). The spatial (vertical) and temporal (horizontal) dimensions of these boxes match the spatial and temporal extent of the conventional ROI analyses performed in panels A–F. All boxes are 6 ms (3 samples) wide.

