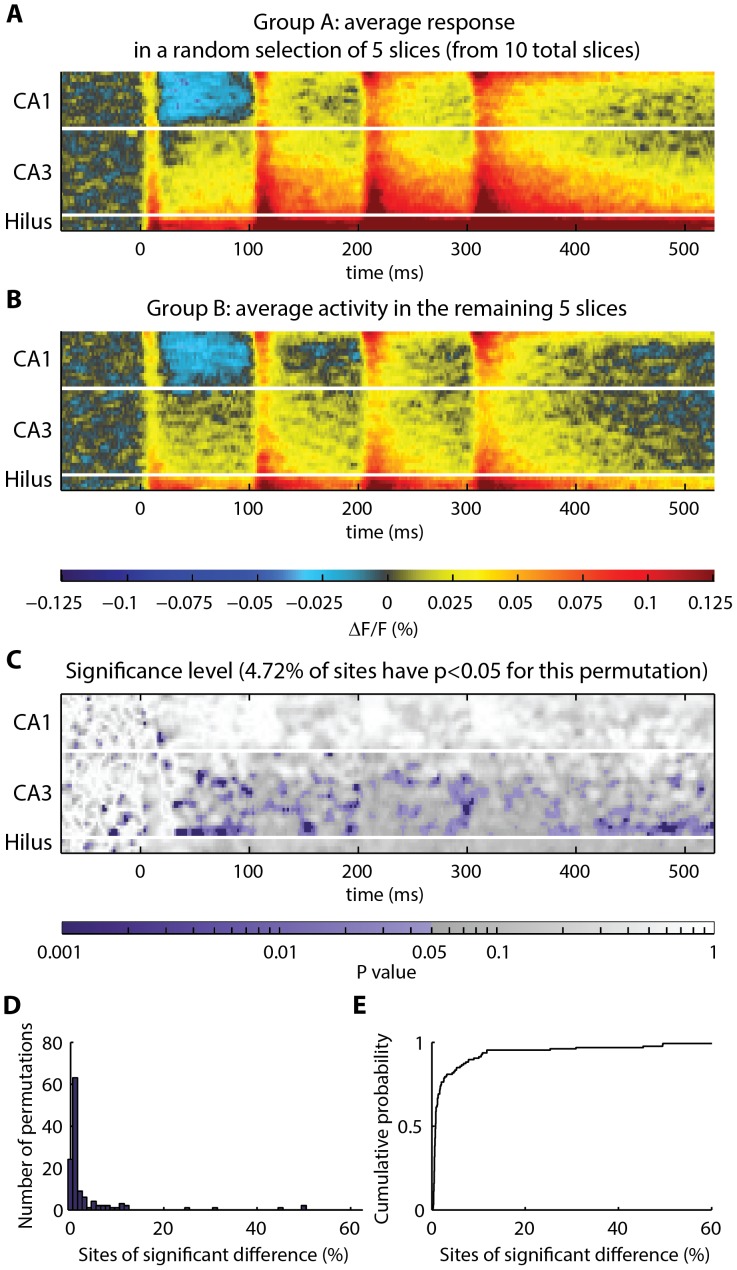
Figure 7. Frequency of sites identified as significantly different in control data: response in stratum radiatum following temporoammonic pathway stimulation.
(A–B) A total of 10 slices were shuffled and divided into two groups, “Group A” and “Group B”. The average of each group is shown. (C) Heatmap, showing p-values obtained by comparing Group A to Group B at each spatiotemporal site. P-values less than 0.05 are colored purple. For the random Groups A and B, significant differences were registered at 4.72% of sites. (D–E) Histogram and cumulative probability distribution, showing the number of positive sites obtained from permutation test comparison of all possible groupings of the data into 2 groups of 5 (126 unique combinations). Under the null hypothesis, the theoretical rate of observation of positive sites is predicted to be 5% for α = 0.05. In 126 permutations of the actual data, 3.97% of sites were registered as significantly different.

