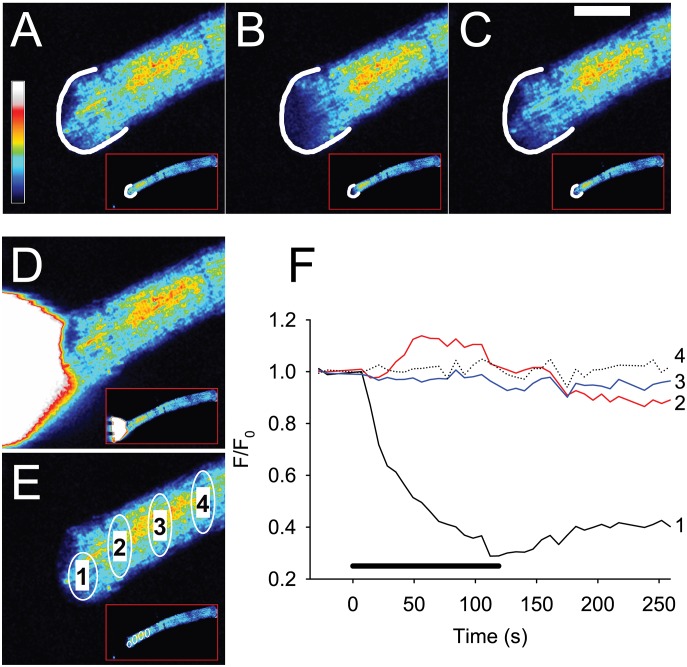
Figure 2. Application of 100 µM FCCP to the end of a FDB fibre induces localised release of TMRE from mitochondria indicating that these have become depolarised.
The colour panels A–C show the TMRE signal in the end of the magnified fibre and also in the whole FDB fibre in the lower right of each panel (marked by red box) at rest (A), at the end of 120 s of FCCP application (B) and 130 s after removal of FCCP (C). In panels A–C, a white semi-circle indicates the end of the fibre. Note that loss of mitochondrial TMRE occurs at the site of FCCP application, spreads less than 50 µm distally and is partially reversible. Panel D shows a white cone visualised using sulforhodamine B which indicates the region of the fibre exposed to FCCP. Panel E shows the sites at which changes in the TMRE signal were measured (numbered 1 to 4) during the experiment. The graph in panel F shows that in mitochondria close to the site of FCCP application, the TMRE signal falls to a minimum of ∼0.3 after 110–120 s. In contrast, at site 2 that is only 40 µm from the site of FCCP application, the TMRE signal actually increases during the period of FCCP application. At sites 100 and 150 µm distant from the site of FCCP application, there is no change in the TMRE signal. The coloured bar to the left in A shows the LUT from low (blue) to high (white) values applied to each pixel in the image. The thick black bar in F indicates the period of FCCP application. White horizontal calibration bar in C represents 50 µm.

