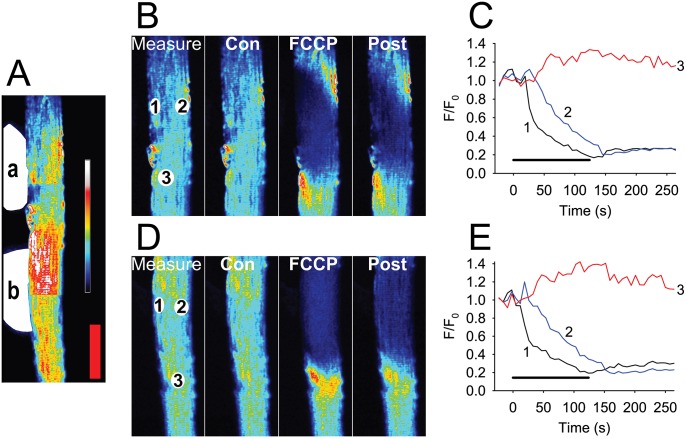
Figure 3. Sequential broadside application of 100 µM FCCP at two separate regions in the same FDB fibre.
FCCP is applied sequentially to two regions of a fibre (A, indicated by the white areas labelled a and b to the left of the fibre) and induces release of TMRE from mitochondria only in the area exposed to FCCP. Panel B shows an enlargement of region a and panel D shows an enlargement of region b. Regions of interest (ROI 1 to 3) used to extract intensity traces for C and E are shown in B measure and D measure at rest (Con), at the end of 120 s of FCCP (FCCP) and 130 s after removal of FCCP (Post). Panels C and E are plots of the changes in the TMRE F/F0 at the three ROI sites before, during and after the application of FCCP to the fibre. In mitochondria at site 1, F/F0 falls to a minimum of ∼0.3 after 110–120 s. At site 2, F/F0 also declines with a time lag of about 20 s. Importantly at site 3 that is only 50 µm from the site of FCCP application, the TMRE signal does not decrease but rather increases during and after the period of FCCP application. The coloured bar to the right in A shows the LUT from low (blue) to high (white) values applied to each pixel in the image. Red vertical calibration bar in A represents 50 µm.

