
Figure 4.
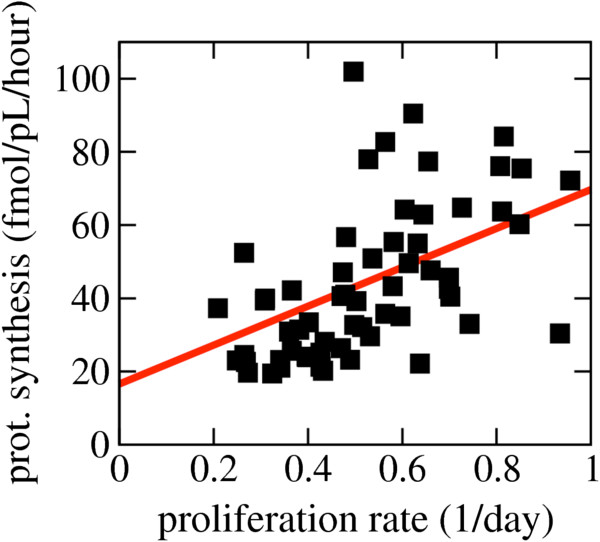
Correlation between protein synthesis and proliferation rates after normalization by cell volume. The protein (prot.) synthesis rate per cell volume as a function of the proliferation rate. Each symbol represents a cell line in the NCI60 panel. The red line represents the theoretical expectation (Equation 1).