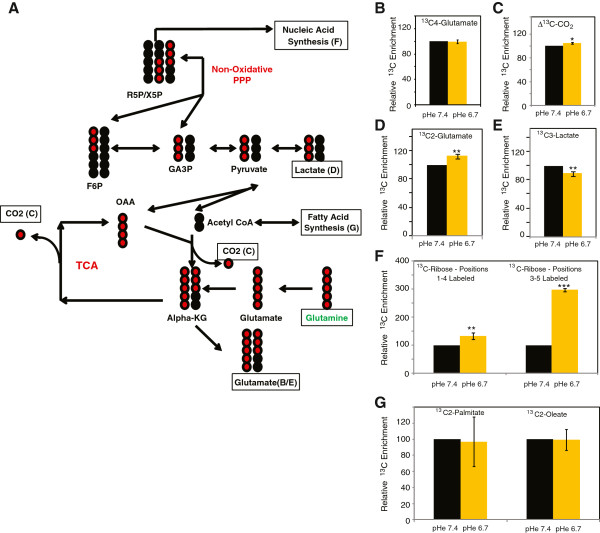
Figure 2.

The use of 13C glutamine isotope tracer to analyze glutamine metabolism under acidosis. (A) Schematic graph indicating various measured metabolites (and corresponding panels) resulting from the uniformly 13C labeled glutamine tracer (green). The 13C labeled and unlabeled carbons are indicated in red and black, respectively. (B-G) Relative 13C enrichment in the glutamate (B,D), CO2(C), lactate (E), ribonucleic acids (F) and fatty acids (G) under control or acidosis conditions. Glutamate (B,D) is presented as both the 2 (C2 (D)) and 4 (C2 (B)) labeled carbon subpools. Lactate (E) is presented as the uniformly labeled 13C3-labeled lactate. Ribonucleic acids (F) are presented as the 13C positions 1 to 4 and 13C positions 3 to 5 subpools. Fatty acids (G) are presented as 2-carbon 13C-labeled palmitate and oleate. Error bars are mean ± SD, significant P values are indicated (*P ≤0.05, **P ≤0.01, ***P ≤0.001).
