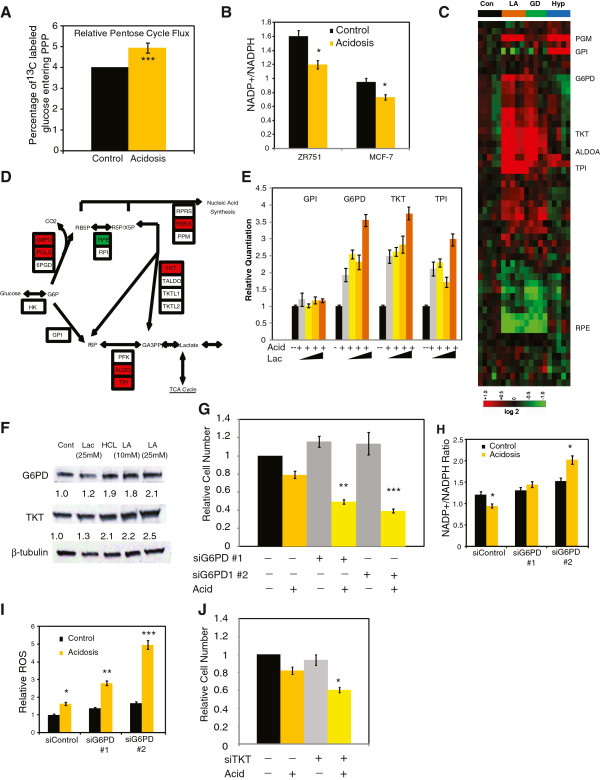
Figure 4.

Acidosis enhanced oxidative branch of pentose phosphate pathways (PPPs). (A) Percentage of glucose that enters the PPP under control or acidosis conditions. (B) NADP+/nicotinamide adenine dinucleotide phosphate (NADPH) ratio for MCF-7 and ZR-75-1 cells under control or acidosis conditions (n = 6). (C) Heatmap indicates the transcriptional changes of genes listed by the Kyoto Encyclopedia of Genes and Genomes (KEGG) in the PPPs under hypoxia, lactic acidosis or glucose deprivation conditions. (D) Genes in PPP were induced (red) or repressed (green) by at least 1.7-fold under lactic acidosis. (E) The mRNA expression of glucosephosphate isomerase (GPI), glucose-6-phosphate dehydrogenase (G6PD), transketolase (TKT), and triose phosphate isomerase (TPI) under control or acidosis conditions with 0, 4, 10 and 25 mM lactate. (F) The protein levels of G6PD, TKT and β-tubulin in MCF-7 cells under acidosis, lactosis (25 mM), or lactic acidosis (10 mM and 25 mM pH 6.7) conditions with the relative changes (by densitometry) shown. (G) Relative cell numbers of MCF-7 cells that have been transfected with control or two small interfering (si)RNAs targeting G6PD under control or acidosis conditions. (H) Relative NADP+/NADPH ratios in MCF-7 cells, transfected with control or two G6PD-targeting siRNAs, under control or acidosis conditions (n = 4). (I) Relative ROS in MCF-7 cells transfected with control or two G6PD-targeting siRNAs, under control or acidosis conditions. (J) Relative cell numbers of MCF-7 cells transfected with control or TKT-targeting siRNA under control or acidosis conditions (A). Error bars are mean ± SEM, P values as indicated (*P ≤0.05, **P ≤0.001, ***P ≤0.0001).
