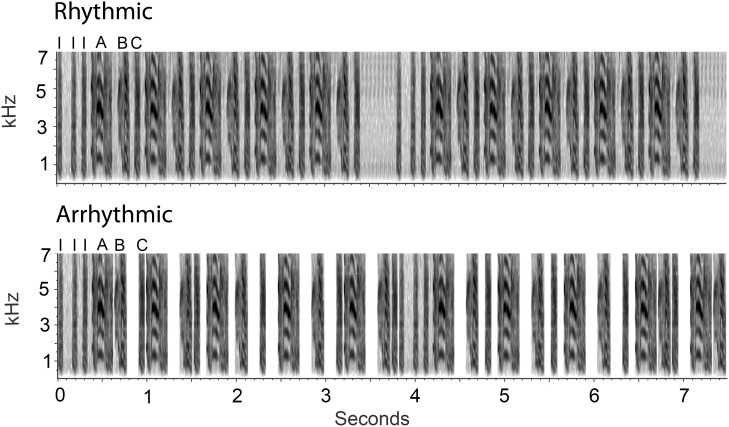
Figure 1. Representative spectrograms of rhythmic and arrhythmic song.
Images depict 7.5 seconds of representative rhythmic and arrhythmic song stimuli. They were generated from the same natural song. Introductory notes are indicated with I. A, B, and C indicate 3 distinct notes that compose a motif. Each image contains two bouts of song.

